
Hello, fellow Forex traders!
Today we will examine an interesting intraday Forex strategy Scalping System TMT. On foreign resources, this indicator Forex system for scalping is becoming more and more popular, and it is time for us to get to know her more, reviewing all the details, strengths and weaknesses of the strategy on the pages of our blog.
Trading strategy TMT as popular among experienced traders and beginners, thanks to minimal losses if you trade on small timeframes and the possibility of reaching the plus end of the day due to the large number of transactions. Well, if that was indeed the case — we learn from our today’s material.

Characteristics of the TMT strategy Scalping System
Platform: MetaTrader 4
Currency pairs: any
Timeframe: M5 — H1
Trading time: around the clock
Recommended brokers: Alpari, RoboForex, TickMill
The idea of the strategy TMT

The basis of a trading system based on the principle of trade in the trend direction of the daily candle, so the timeframe is limited to H1. Bottom bracket the time interval M5 translates strategy into scalping mode, significantly increasing the number of transactions.
The currency pair can be any, but it is best if you use these strategies focus on the trend in which there is movement, especially at the majors.
Strategy TMT can be used around the clock, but recommended European and American sessions. In the Asian session movements less, and that time is rarely used for scalping. Also the trader should be prepared for additional losses due to flat in the second half of American session and Asian session due to the effect of “safe Harbor”.
The important advantages of trading system Scalping System TMT:

- The ability to use different trading instruments;
- Filter system about transactions;
- Tactics inputs on pulses provides a “margin of profit” from the first minutes of trading.
TMT (stands for Trend — Momentum Trendline) — trend scalping trading system based on the combination of two trend-following indicators and oscillators are two. First determine the current daily trend, the second turning point in his direction after the correction. To confirm the strategy is additionally used a breakout of the trendline of the local correction movement, for detection which apply a graphical analysis.
The composition of the TMT strategy includes another pair of auxiliary, information indicators, the first of which displays on the chart the candle older, daily timeframe, the second carries significant horizontal levels drawn on charts of time frames from H1 to MN1. This allows the trader to accurately navigate in the installation of stop losses and take profits.
Installing TMT Scalping System

The files of the TMT strategy Scalping System you can download from the link at the end of the review. The installation of the component parts of the strategy (indicators and templates) in the terminal MetaTrader 4 is the universal technique described in the article on the website.
Strategy is added to the chart template TMT New, using the menu of the right mouse button, or by selecting “Template” on the quick access toolbar. It will look like installed TS MT4:
 Indicators trading system Scalping System TMT

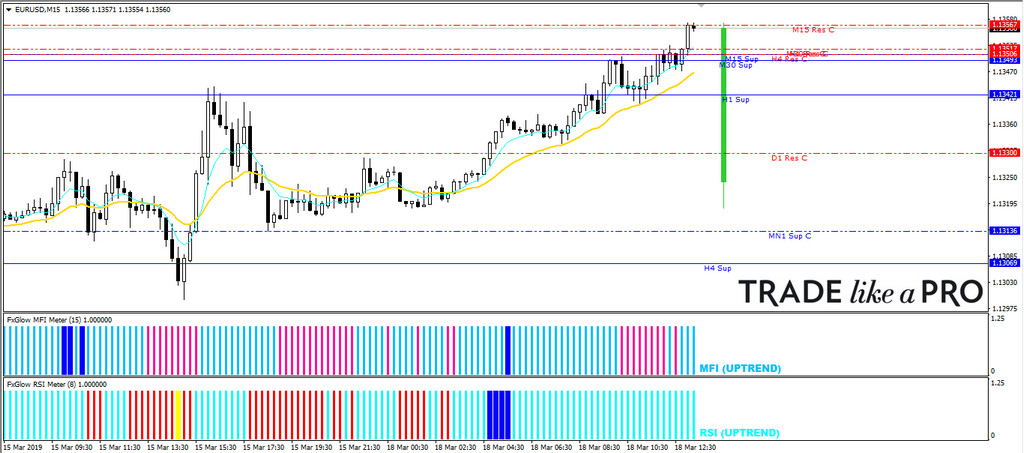
The graph shows the following main indicators:
- Two EMA moving averages with periods 20 and 7, which determine the direction of the local trend within the day;
- Two modified oscillator: the MFI (Money Flow Index) based on tick volume, and RSI. In contrast to the conventional view, the indicators give 4 kinds of signals by the color of the histogram bar: the trend is up, down, overbought (crossing the level of 80) and oversold areas (below the level of 20). The layout of the levels are hidden.
 On the chart are automatically displayed:
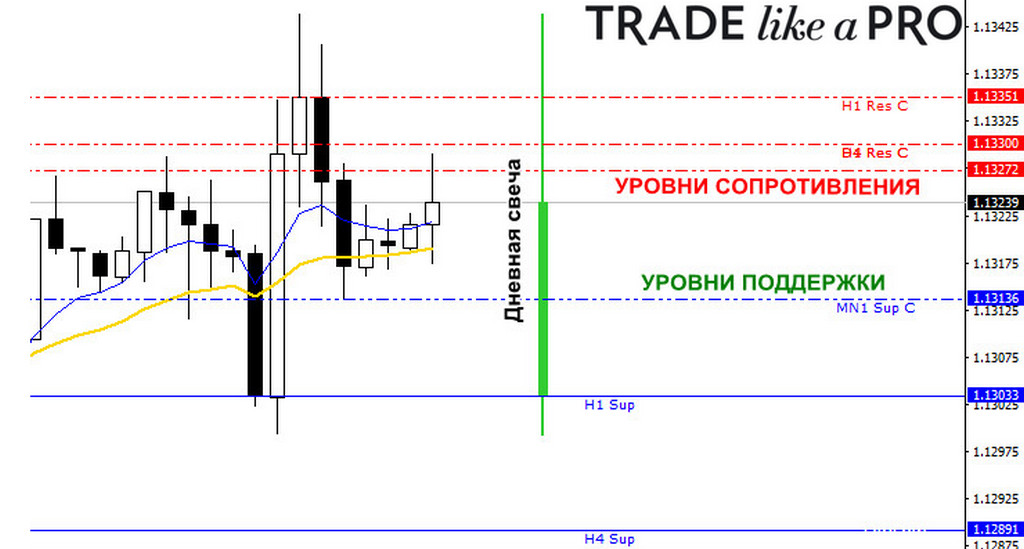
- Levels of support and resistance on higher time frames recommended locations for stop-losses and take-profits;
- Daily candle, color displays the current trend direction on D1.
Rules strategy

Trade direction is determined in accordance with the trend of the D1 candle. So keep in mind that it may change during the session, especially early in the day. Trading signals are determined by the indicators and the trend line of the price channel, which is used as an additional filter signal.
Conditions to enter short:
- Current daily candle is red;
- On the indicator the RSI Filtered FxGlow formed the red bar;
- On the MFI indicator FxGlow Meter formed column pink;
- Blue moving average is below the yellow (current TF trend is down);
- Price retraced into the area between moving averages from the bottom up.
Under these conditions from the lowest low to the left, draw a slanted trend line and waiting for her breakdown.
 Open trade protected with a stop loss set above the nearest local maximum or resistance level marked with the indicator TMT.
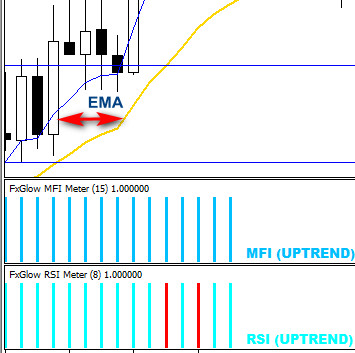
Conditions for entry into a long:
- Current daily candle, display indicator, green;
- On the FxGlow Filtered RSI indicator formed a column of blue;
- On the MFI indicator FxGlow Meter formed a column of blue color;
- Blue moving average is above the yellow (current TF trend is pointing up);
- Price retraced into the area between moving averages from the top down.
After fulfillment of these conditions, draw a slanted trendline from the highest high and waiting for her breakdown.
 Stop loss is placed under the nearest local minimum or below the levels of support/resistance shown by the indicators of the strategy.
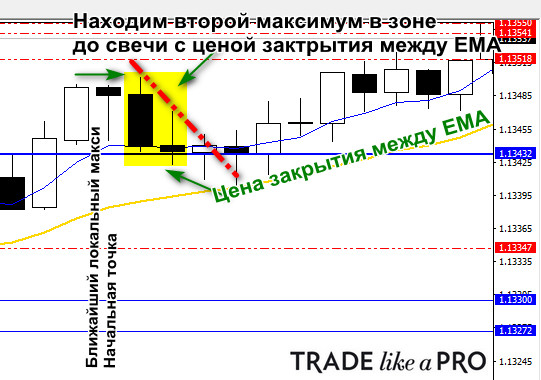
Build trend line strategy TMT Scalping System

The trend line is built by the trader, after entering the closing price of the candle in the range between moving averages EMA. Its beginning is always the same as:
- A local maximum for the transaction to long;
- A local minimum for a deal in shorts.
The second construction point of the trend straight line is the maximum or minimum, selected from a number of candles, facing the candle with price closing in the area between the two exponential moving averages (EMA).
 The choice of stop loss and take profit Scalping System TMT

The strategy includes indicator which automatically migrates to graph lines of support and resistance, since the timeframe to M15 and weekly candles. This is the help guides for the trader to reduce the probability of triggering stop-loss or close a trade in profit before the reversal of quotes to the correction.
 A standard measure of stop loss is a stop loss which should be from 10 to 20 PM. Take profit should be 1.5-2 times the size of the expected loss in order to maintain the overall profitability of the system.
Money management strategy TMT Scalping System

Lot size, you can count on our website under Tools -> Calculators -> Calculator lot. As a rule, the investment in the transaction would not lead to the loss of more than 0.5% up to 2% of the total amount of the Deposit on your account if the stop loss triggers.
For clarity — below we have compiled a table with the lot sizes of the Deposit and appropriate account with a broker. The stop loss default is 20 points, risk per trade 1%.
Examples of business strategy TMT Scalping System

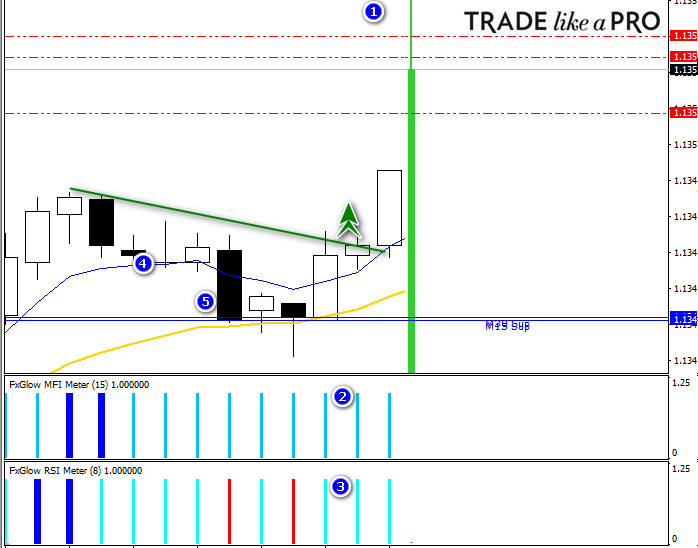
Example 1: indicator strategy Scalping System TMT painting a green daily candle, this signals that all transactions will be held in purchase.
Fast moving EMA 7 crossed below the slow EMA 20, after completing the first condition of the strategy. The second condition is a rollback and closing prices in a zone between the moving averages takes place after 30 minutes (6 five-minute candles), after crossing indicators.
Draw the trend line resistance from the local maximum to the left, through the second extremum of candles correction. It falls on the candle that signaled on the closing price between the two EMA.
Waiting for breakout of local resistance, but the entry point is determined by the confirmation of a momentum indicator MFI (blue column) and the oversold RSI (turquoise bar). On the graph is the point 4, the purchase of which is necessary to protect the stop loss is located on two tick below nearest (left) local minimum.
 Take profit set in the area of horizontal resistance (these zones are marked on the chart by a red dot-dash).
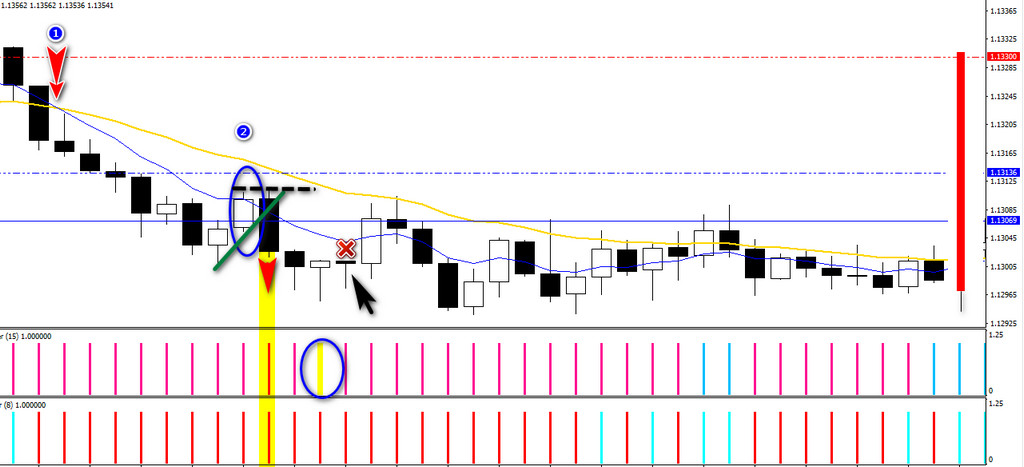
Example No. 2: entrance to the sale determined the red color of the indicator of the daily candle, which is confirmed by the position of the fast EMA was below the slow moving average.
Despite the decline, the recoilless trends does not happen, and after 7 candles 15 minute timeframe price has closed just above the moving lower, which allowed to obtain a second signal strategy.
Draw a slanted support and look forward to her breakdown, which occurs almost immediately, so pay attention to the signals the basement of the indicators MFI and RSI. Pink and red color indicates the coincidence of all factors for sales. Opening the transaction, stop-loss set at the nearest maximum of the candle.
A strong trend is the danger of forming correction, which is indicated by a yellow column of MFI, the appearance of which we have no “stock profit”, so you can look the opportunity to close the deal on the entry price, which is given to us in the next 15 minutes. Close to zero and exit time, as shown by a further increase in prices and the ensuing flat.
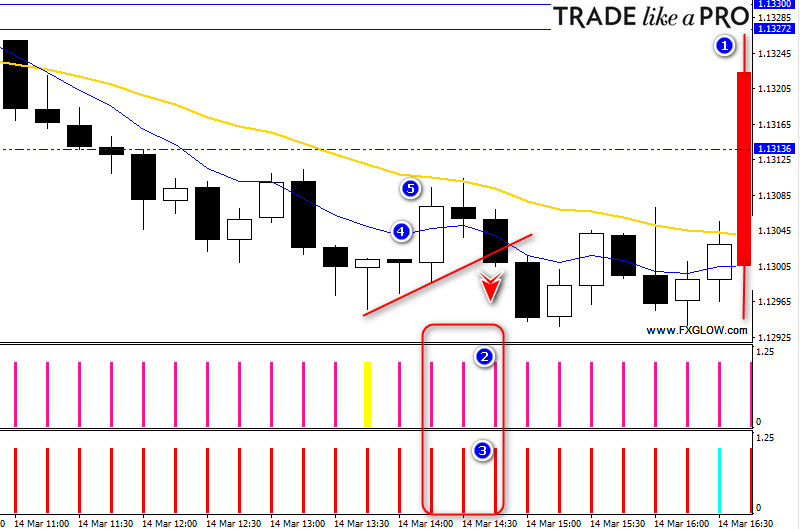
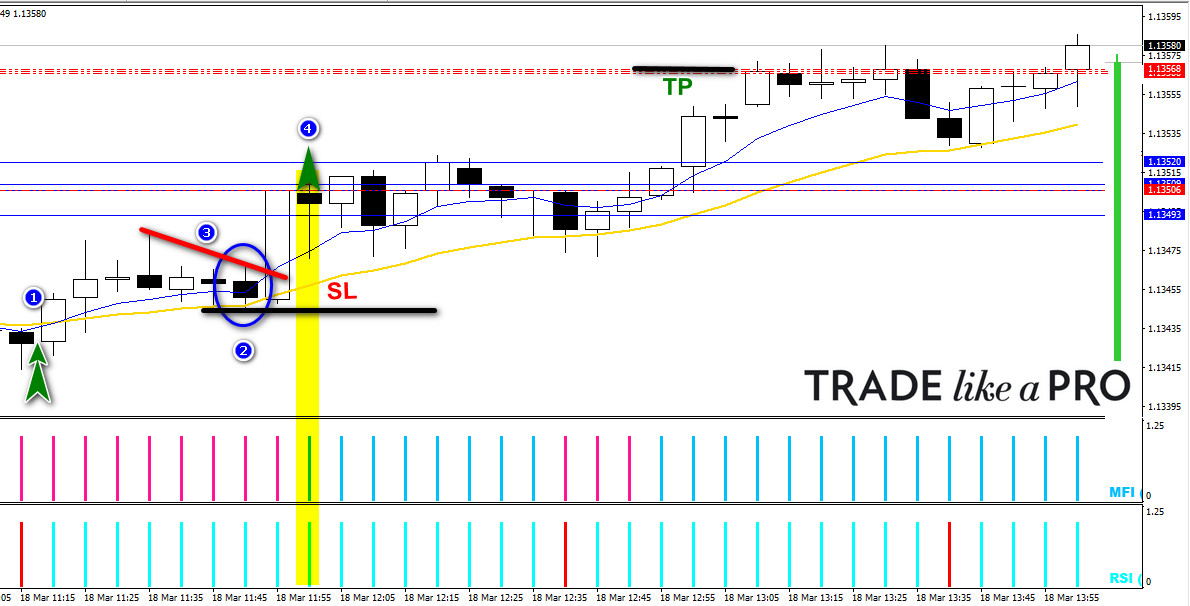
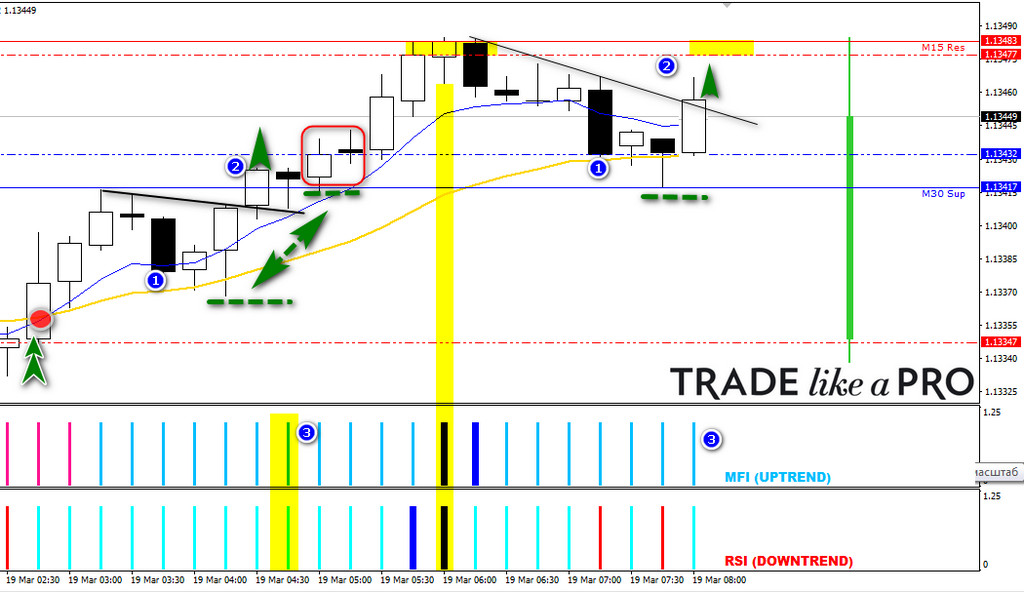
Example No. 3 shows that the strategy allows for long enough to hold position in a strong trend.
During the Asian session has formed a steady upward trend, which allowed the morning to enter long after a falling candle (1) had closed between the two EMA, quotes turned up, breaking the trend line (2), and histograms of MFI and the RSI has given a “color signal” (3).
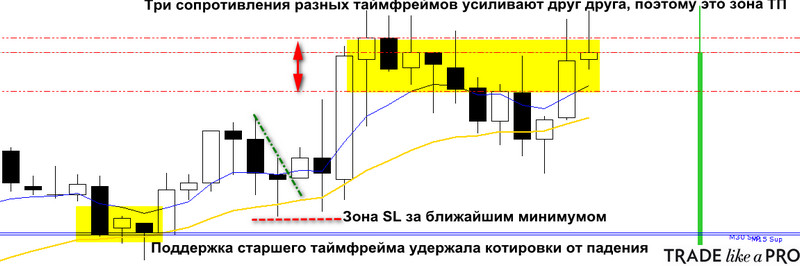
In this example, the transfer posting of the stop-loss from the local minimum closer to the entry point, with additional indicators strategy TMT that carry the support and resistance of higher timeframes on the current chart. Waiting for the fastening of the two closing candles above the support level of TF M30, we moved almost to breakeven the stop loss line.
Despite the fact that it was the intention to hold the position until the change of a trend using a trailing stop, the trade was closed in profit by the hands on the resistance level M30, which almost coincided with the same line on the M15 and the two measures of overbought oscillators MFI and RSI.
Is the number of turning signals led to the correction, but not broken the daily trend. So when three reference signal, enter again long, but now put a take-profit immediately due to the proximity of resistance at TF M30.
 Conclusion

TMT Scalping System — it is a workable system that is suitable for experienced traders and beginners.
Beginners it is interesting primarily for its simplicity, but it is worth remembering the risk / reward ratio, and that the need to attach targets and stops to important levels of support and resistance.
Experienced traders the system can offer the flexibility of individual settings without any rigid framework. It allows traders to add more indicators and applying their own ideas to improve trade. Each trader relies on his own money management and establishes the points of entry/exit positions, on the basis of their risk management.