
Good day, ladies and gentlemen Forex traders.
Today we will talk about a very interesting strategy “Mouse tail”.
This is a simple breakout strategy for GBPUSD, which takes just a couple minutes a day. To trade this strategy can be even from your smartphone, as no lights are used. In my opinion, it is very important, as mobile trading is up to 50% of the total volume of open positions with brokers.

Rat tail – a strategy for the GBPUSD on the D1 for a couple of minutes a day 
The idea of the strategy I got an interview with an American trader Avery Hawthorne. There have been several interesting ideas. It is strange that no one on the forum did not pay attention to them and left comments.
As we all know, the candles on the graph distinguish the “body” and “tails” or “shadows.” Key to this strategy are the tails of the previous closed daily candle.
Avery shared an interesting observation – if the price is in the zone of the tail of the previous day candles, that in 70-80% of cases of her leaving. Usually the price goes at or below the Low point, if we are talking about the lower tail, or above the High in case of the upper shadow. Sometimes the price gets in the area of the body, but almost never stays in the zone of the tail.
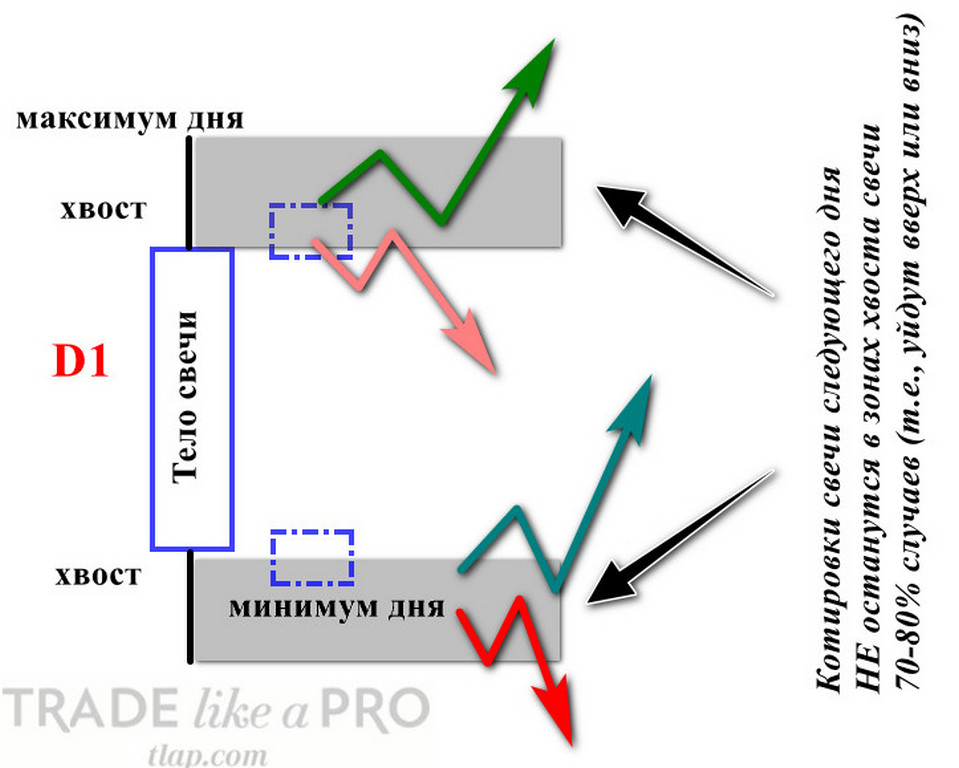

At the same time in the area of the candle body a lot of liquidity and stop losses. “Market sharks” love to hunt these footsteps, so that the area of the body there is a brutal massacre. So trading in the direction of the body, of course, possible, but it requires very great skill and very unsafe. Easy to get into an unnecessary transaction and receive a loss. For this reason, we consider only the breakout High / Low.
And if to be limited only by the breakdown of High / Low and not expect too much from the market, so to say, “pick up the scraps from the table of sharks”, it is possible to get a very good profit.
Rules of entry and exit

Now let’s consider the strategy in detail: where to put take profits, stop losses and so on.
So closed the previous daily candle, opened a new. We need to place a pending Buy and Sell orders. Put them in the following way:
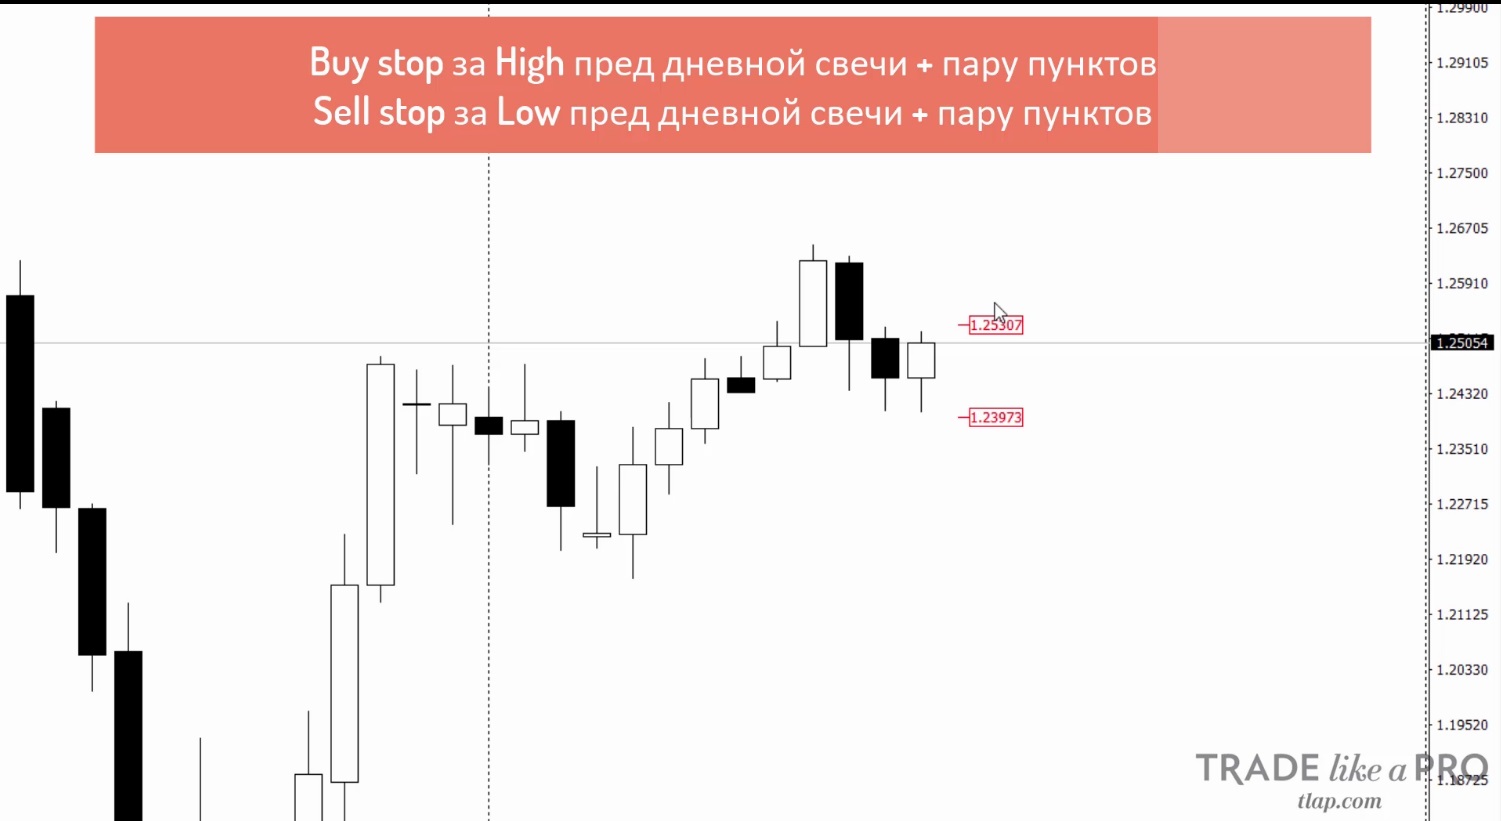
Buy stop – a couple of pips above the High of the previous daily candle;
Sell stop – a couple of pips below the Low of the previous daily candle.
This gap of two to three points, first, helps us to consider the spread, and secondly protects you from the sharks that may attempt to collect liquidity in the points with the High and Low of the candle. Completely accidental activations of orders this pair of points will not save, but it’s pretty good protection from unexpected market movements will provide.
Now go to setting stop losses and take profits.
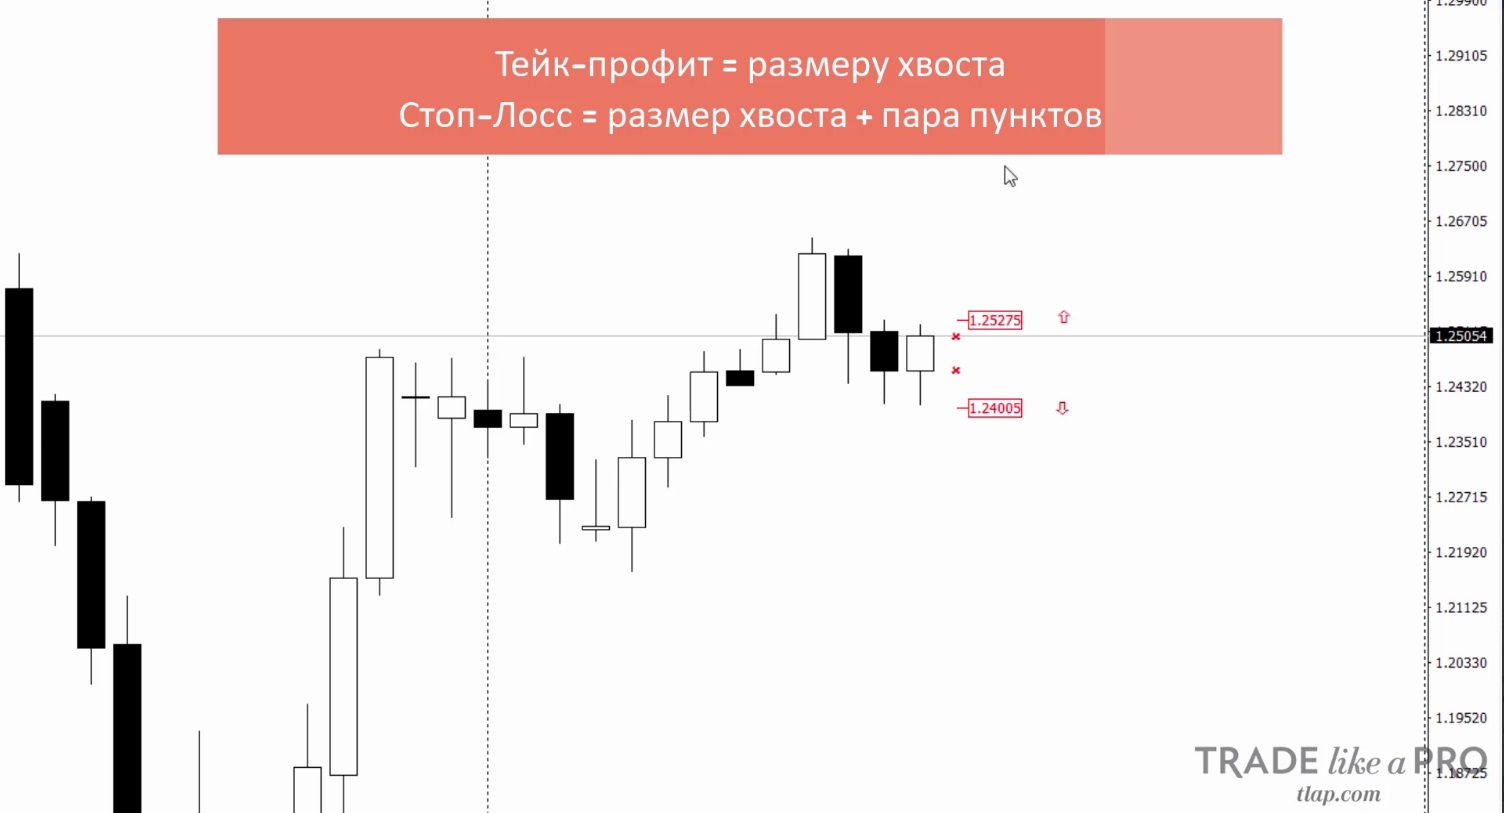
Stop-loss set at a distance equal to the tail of the previous candle plus two points for the case of spread and unexpected market movements.
Similarly, take-profit set at a distance equal to the corresponding tail of the previous candle. In our example, is approximately 16 points for the upper tail and 45 for the bottom.
In the end, a complete set our pending orders with stop-loss and take-profit levels should look something like this:
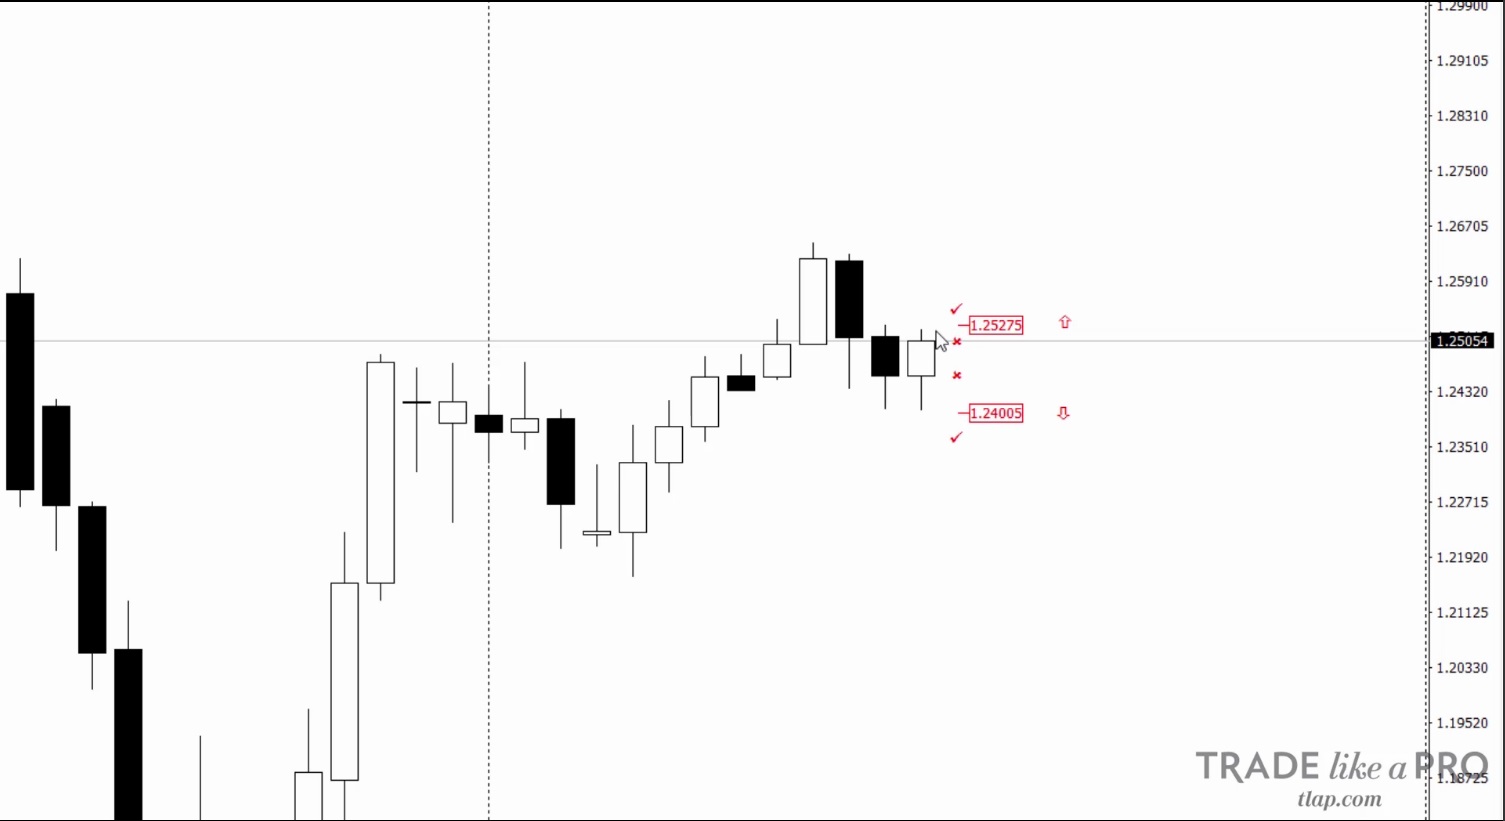
Usually works one of the pending orders. In rare cases – two. And in a particularly active days, both orders can work out a plus.
The details of applying the strategy

The basic rules we were done, but need to parse a few nuances of the strategy. For those who have long been in the market, of course, they can be too obvious, but to repeat it is still useful. Beginners need to remember.
Gaps

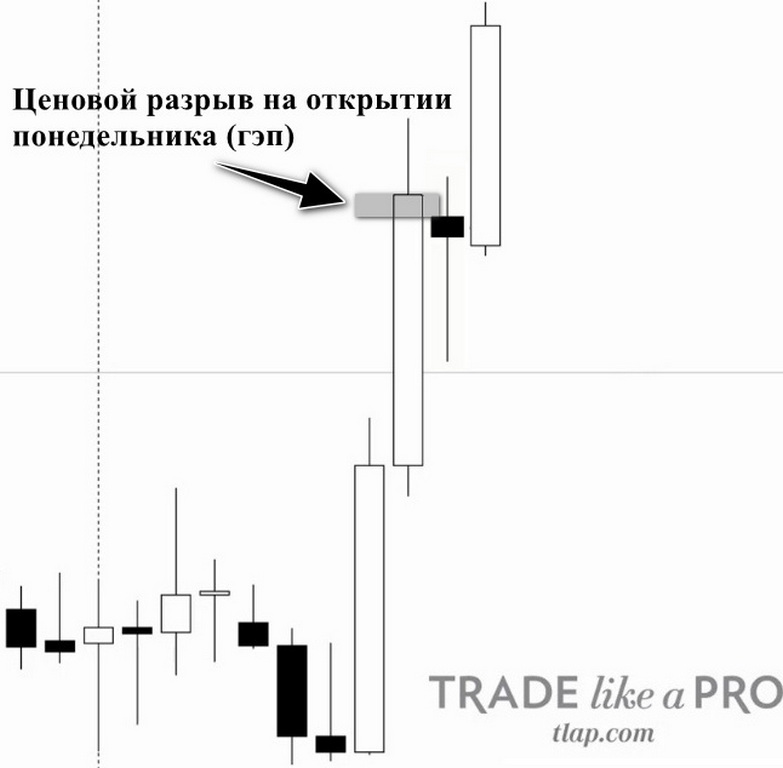
Gaps on Forex rare for the main currencies traded around the clock, often arise after the weekend, as in the example above where Friday closed high, and Monday opened much lower.
In case of a gap, i.e. the gap between the closing price of the previous day and the opening of the next session should be either to trade the gap, or not to trade at all.
How to trade price gaps, on our website there is a separate article. On the strategy of “Mouse tail” on the day of the gap trade deals are not made.
Doji
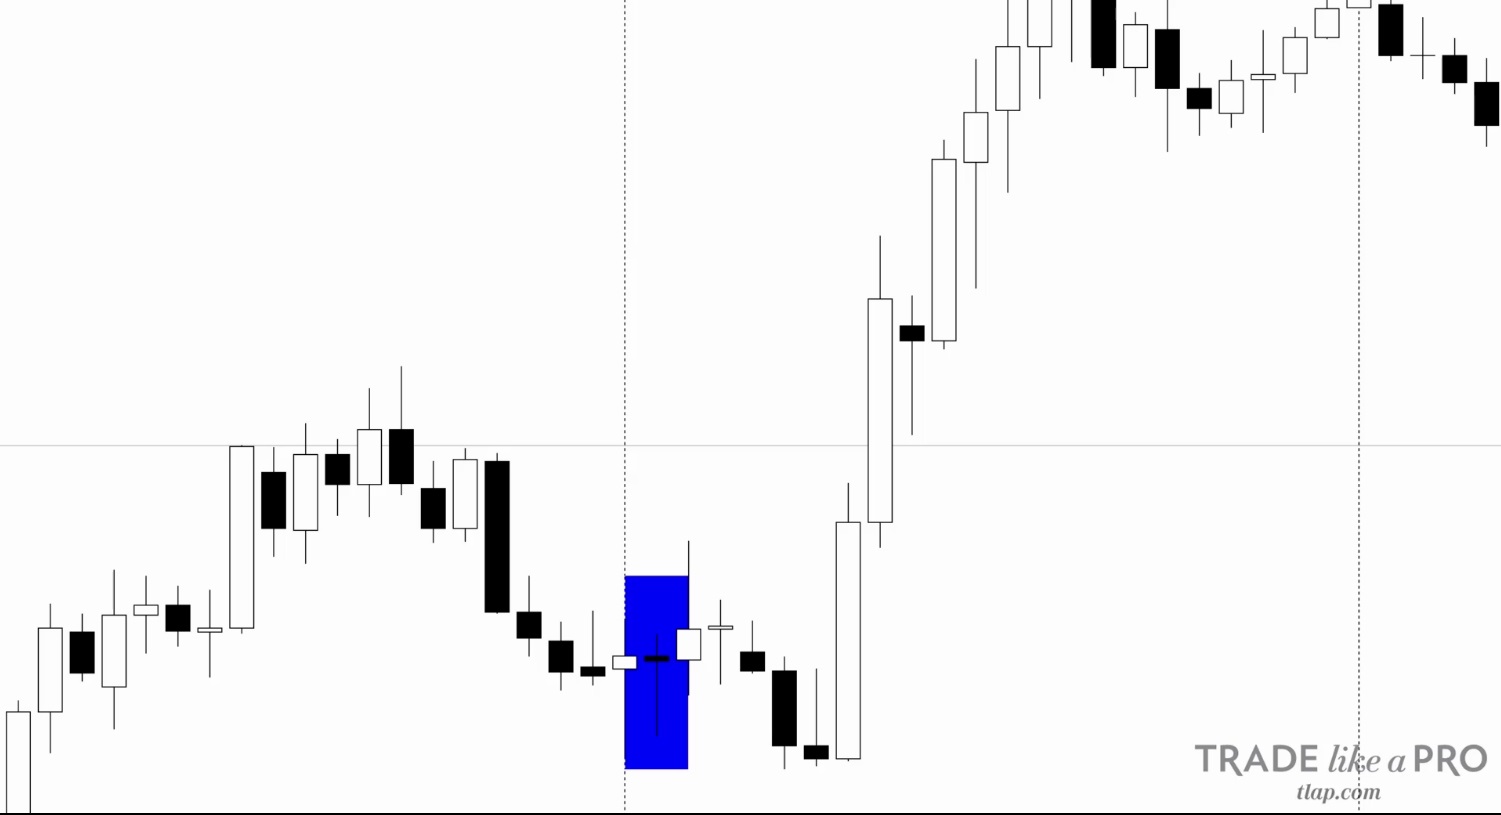
With doji candles with big tails and a very small body, as in the screenshot above – should be careful. It is not recommended to set pending orders after the appearance of the figure, although in practice the doji often work out in plus when trading this strategy.
In my opinion, using this strategy, doji trade is possible, but I admit that it would be risky, so that transactions remain at the discretion of the trader.
Abnormal tails

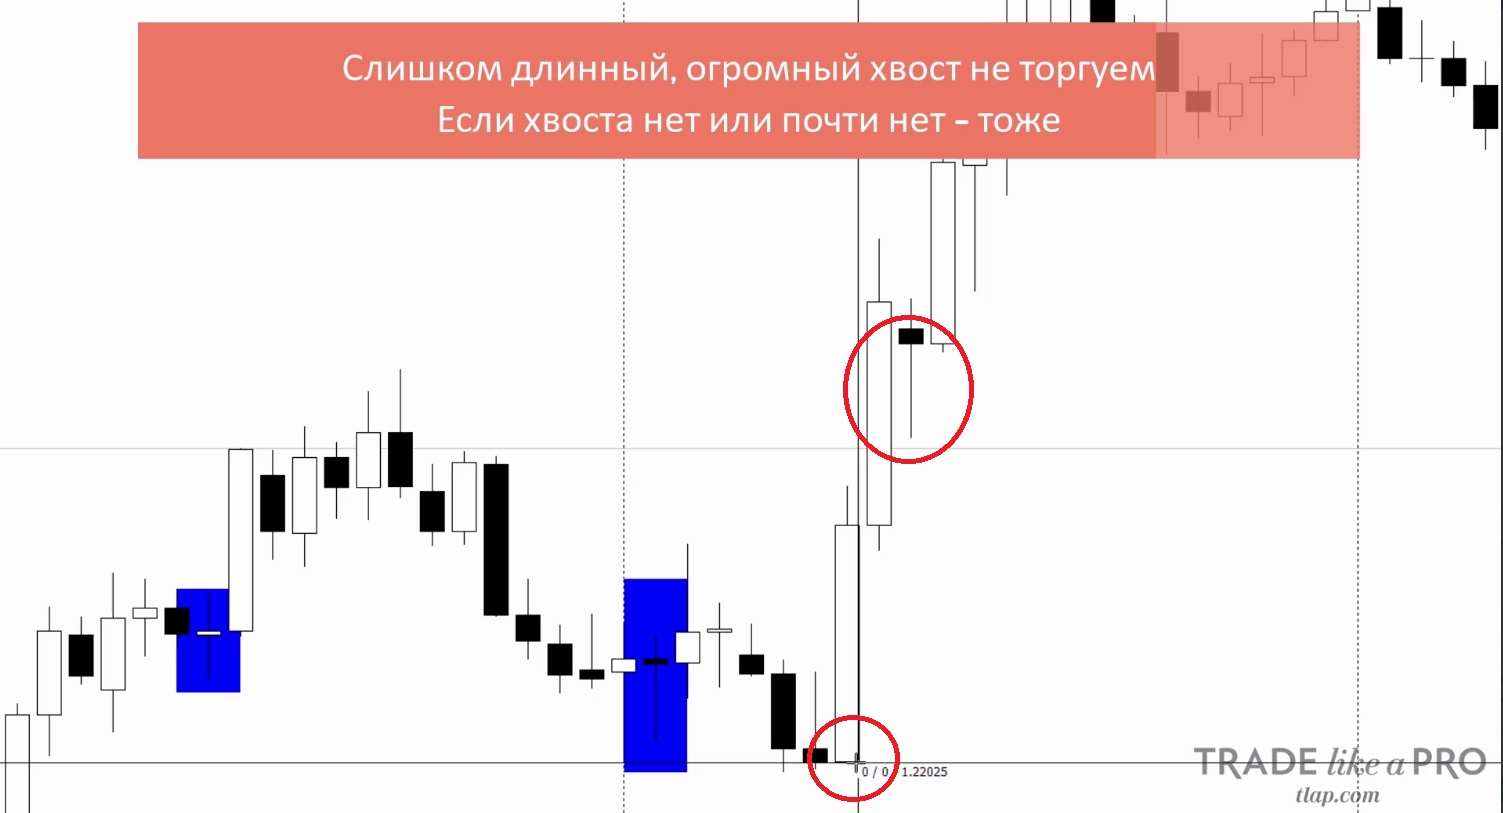
If the tail of the previous candle or no (see example above) – from trade should be abandoned. Also, no need to trade if the tail is too long relative to the body of the candle. If the body is large, and the tail is great – have no fear, even tails for 100 points quite confidently work out.
Nesrabotavshie orders

At the end of the day, of course, all nesrabotavshie orders you want to delete.
In addition, with large tails and, consequently, greater purpose, sometimes it may make sense to 50% of the targets either close the position or move to breakeven. But here we must consider each situation separately and decide for themselves.
Money management strategy
Money management strategy standard 1% on the transaction.
To calculate the lot size you can using the calculator on our website.
Examples of transactions

Since the rules of the strategy very simple, and to analyze the transaction very easy. For example, I opened hour timeframe, while the daily candles are drawn by the indicator Mcandle. For trading strategy the indicator is not needed, I use it only for clarity – it clearly shows where we have exhibited a pending order.
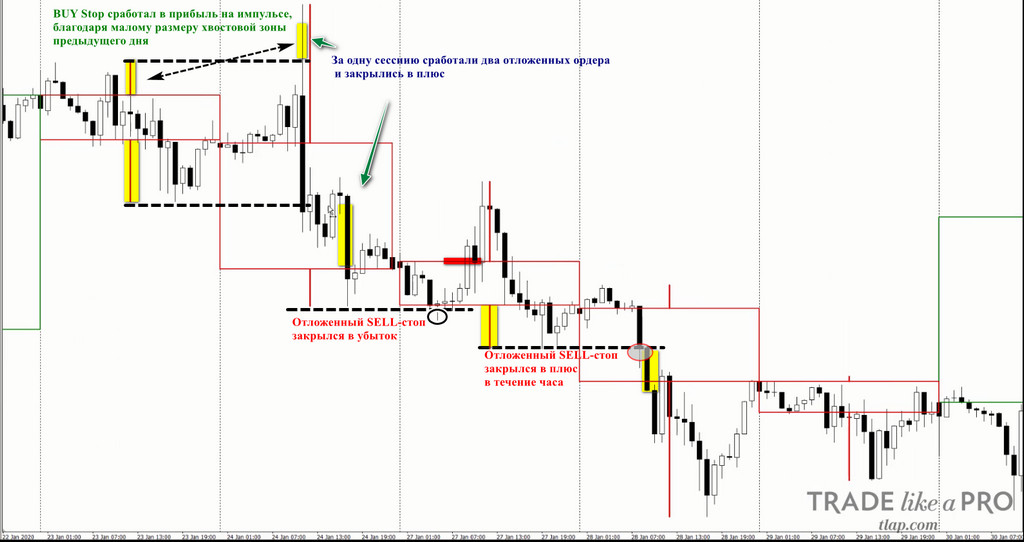
When the market has a clear trend, the strategy works perfectly. So let’s look at the situation a little more complicated:
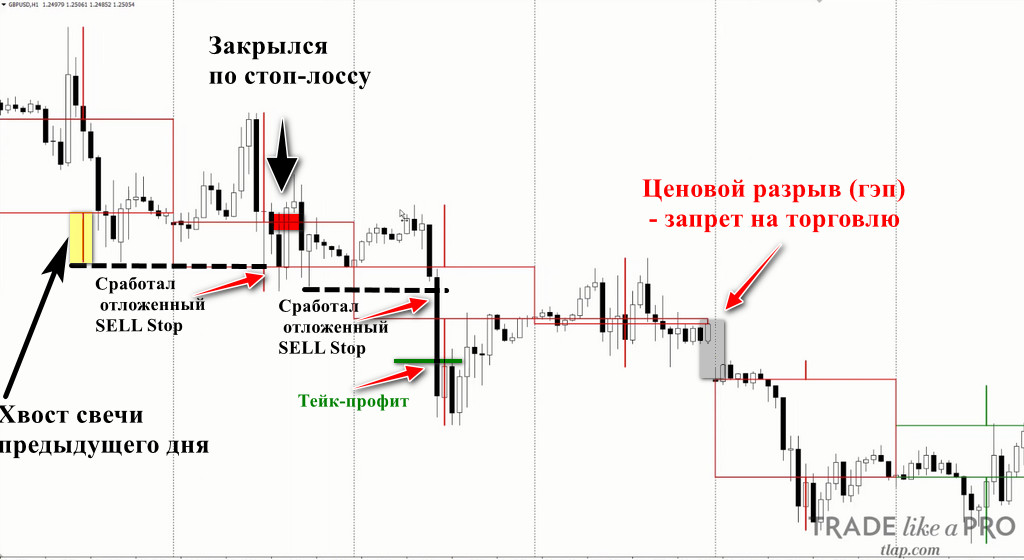
As seen on the chart on the first day of trade on the strategy of “Mouse tail” (the second day in the chart, the first signal candle), we would have worked stop. The next day, if worked would be in profit, then nothing worked, and then we see the gap, after which we should stop trading for the day.
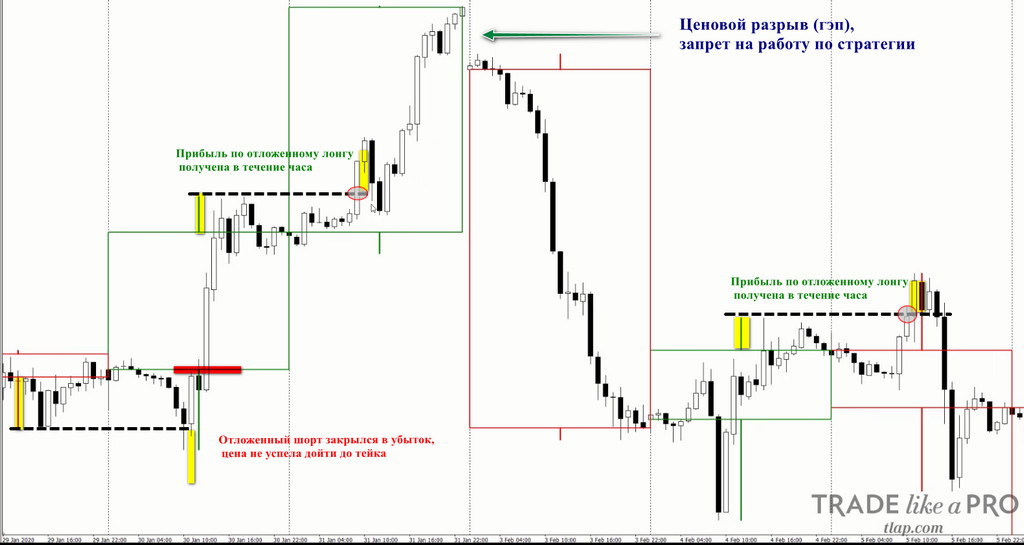
The following example immediately after the gap from the chart above:
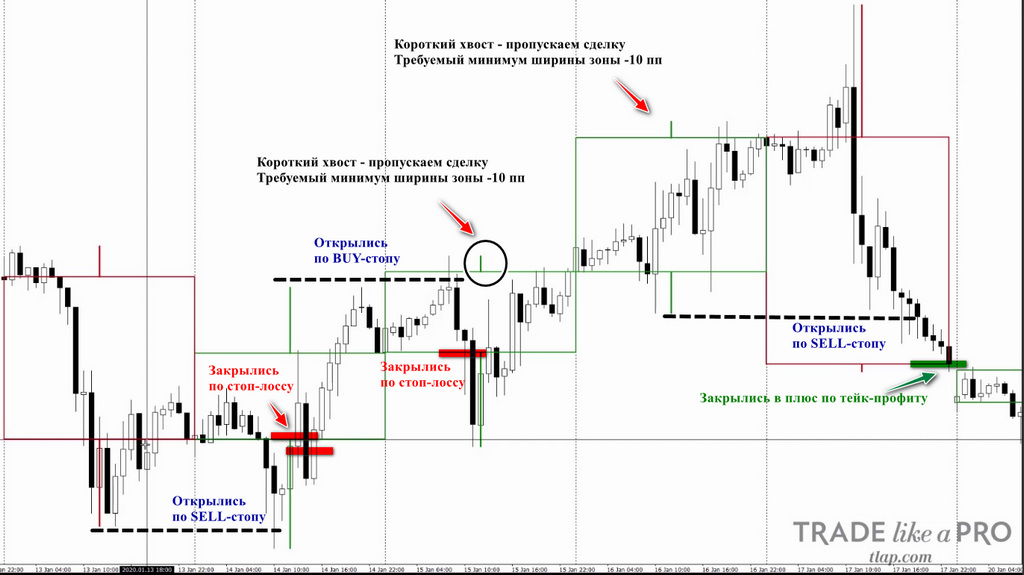
In the first two days after the resumption of trading we have worked of the foot, but then the strategy worked in plus. And at the time of reversal we have worked both pending orders, and in plus, if a trader decided to work on the tail area of small range.
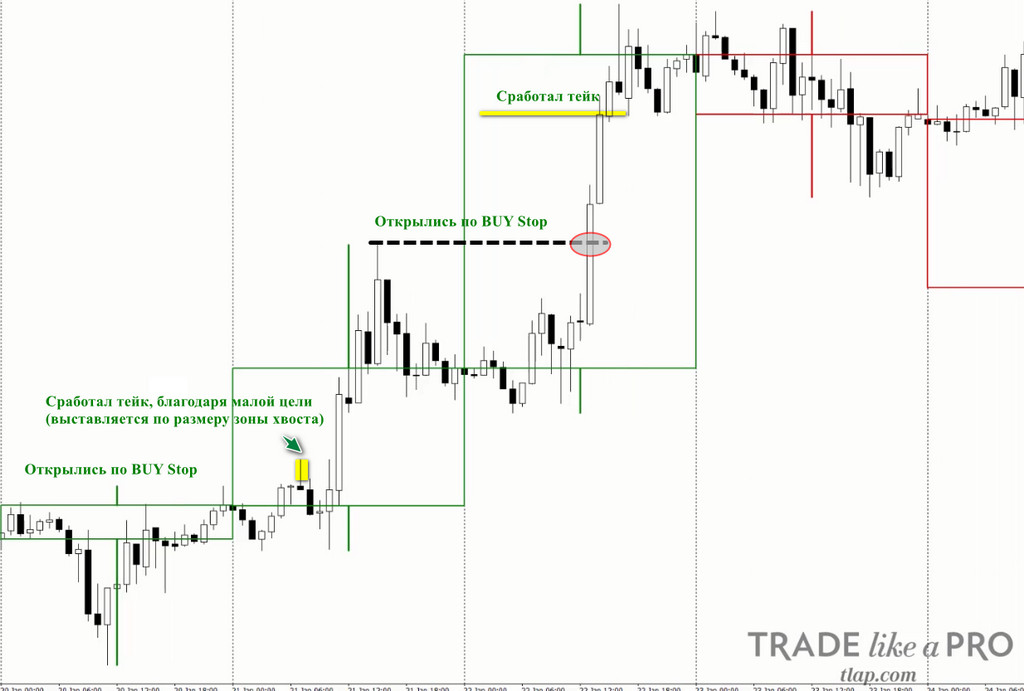
And here we observe an excellent situation for this strategy. A clear trend has led to the fact that the strategy three days in a row worked with a growing order – to 36 points on the third day.
But what happened in the market after this, it is necessary to consider especially.
At the beginning of the chart, we see a clear illustration of why we set goals just for the size of the tail. Price movement would have caused the triggering of take profit, then the price ran more paragraphs five and turned around. Then we see the pending orders for three more days.
And here such situation, when the boundaries of the previous candle was not at all disturbed, arose only once per month.
In General, the strategy can yield losses in the moments of trend reversal and zig-zag movements, but the trend areas is stable and efficient.
Conclusion

“Mouse tail” – this is a very interesting strategy, especially when you consider the amount of time which it requires to trade will need only a couple minutes a day. At the same time with reasonable money management and strict adherence to trade rules, she brings a good profit.
Also it can be adapted to other financial instruments, but will almost certainly require adjustments related to the specifics of each instrument. The General principle is very interesting and has significant potential.
Forum topic