
You never thought, looking at the charts that you’re missing something? One small detail that you just did not notice. After all, much easier than would have us believe. It is on this part and built a trading system, which will be discussed today.
Today we will talk about a very interesting strategy, “the Philosopher”. Even by name it is clear that this TC is for those who learned something in this life and already in a hurry.

Characteristics of strategy
Platform: any
Trading instruments: currency pairs, bitcoin, oil, gold, stocks — anything
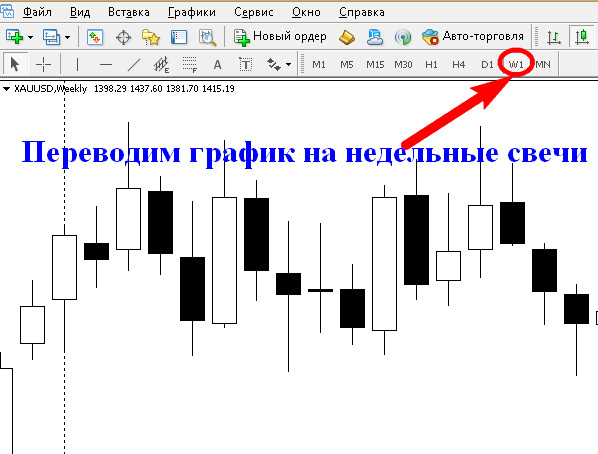
Timeframe: W1
Trading hours: once a week
Recommended brokers: Alpari, RoboForex, AMarkets
The idea at the basis of the trading system

The strategy of “Philosopher” is for weekly charts (in MT4 weekly timeframe is referred to as W1). That is one candle on the chart means we have one week.

So it is intended or for those who are not in a hurry, or Vice versa, for those who have very little time, and the test charts they can point to a maximum of a minute on the weekends.
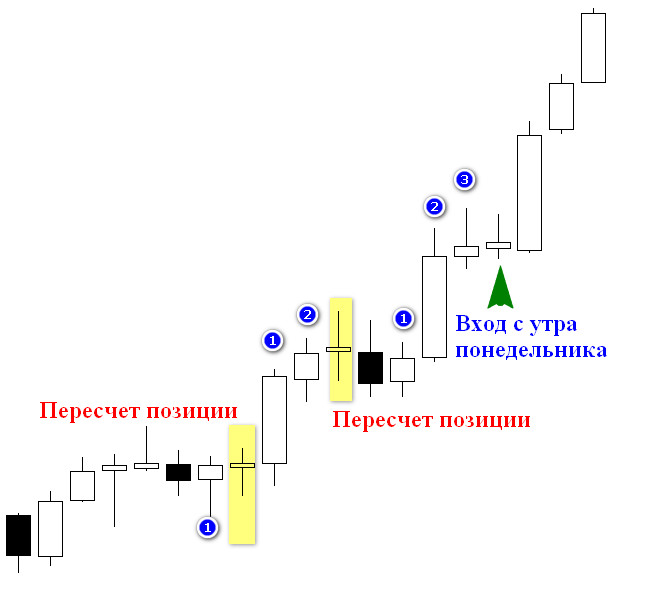
Trades on this strategy are made once a week. You can enter at the opening of the market, but optimally will be the entrance on Monday morning, in this time the prices are more attractive and special weather on a weekly timeframe the time of entry still does not.
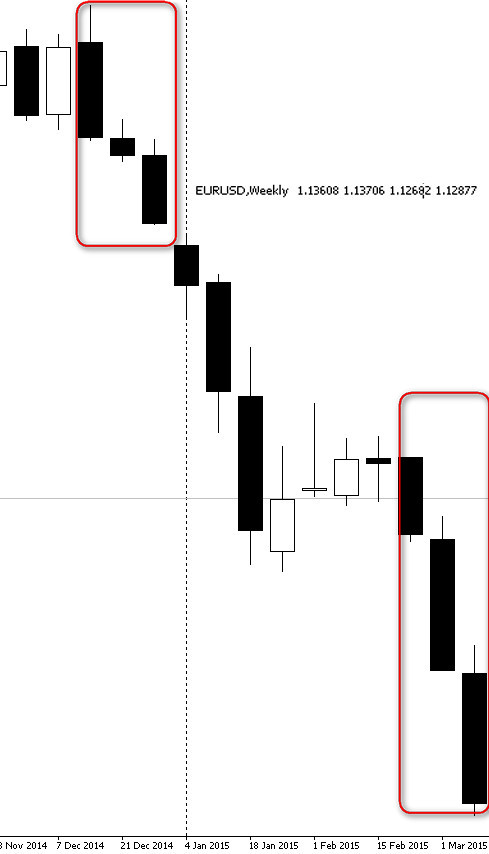
The strategy is very simple and you can use it to trade “anything that moves” because the system is simple and “concrete” idea. We wait until the weekly chart does not appear the three candles in a row in one direction — either bullish or bearish, and then enter in the same direction. And that’s all. Here everything is so simple.
The fact that this pattern of three consecutive weekly candles in one direction — indicates that the purchases or sales of a large number of large traders.
Because in order to move the price of three weeks in a row in one direction, you need a lot of money. And when that happens, it means that someone is very necessary that the price has moved. Well, this snowballing momentum attracts other participants in the market.
It is not necessary to form very strong trends. But count on the continued movement equal to the found formation, from the opening of the first candle to close of the third, without tails, is quite possible. You can often see a stronger movement.
Again, the idea is very simple: if we see three weekly candles in a row in one direction, then in the market a lot of money in this direction to push the price.
The rules of the system

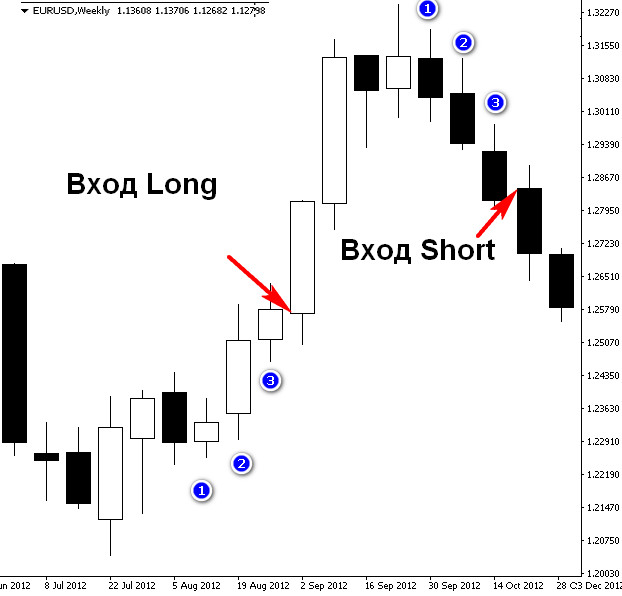
The basic rules you’ve probably already realized that waiting three unidirectional candles in a row and enter Monday morning in the same direction.
The candles should be obvious — their body must be seen “naked eye” without the approximation graph. Doji almost without a body, we do not consider.
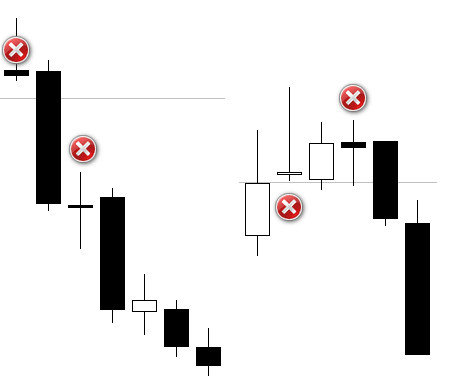
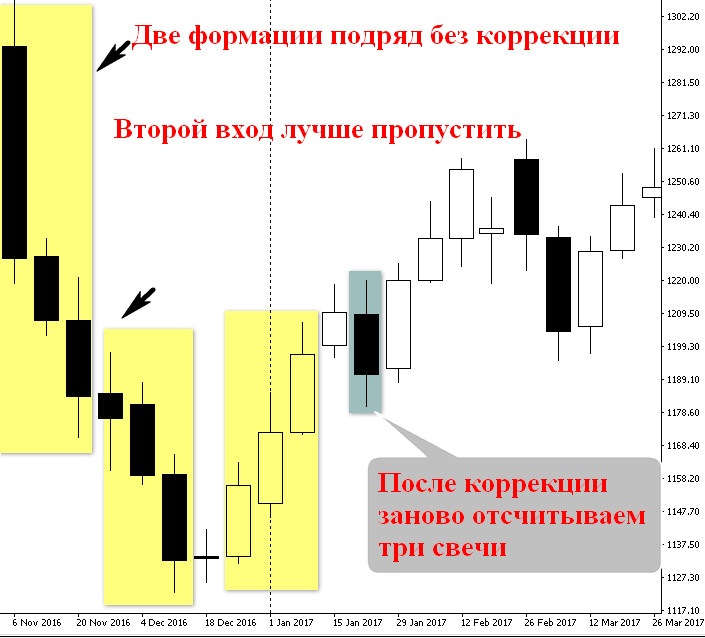
Moreover, if a candle body which is not visible on the distant chart, interrupts our formation, we begin counting the three candles in a row again. In other words, it should be obvious “even to a child” who this week won — the bulls or the bears.
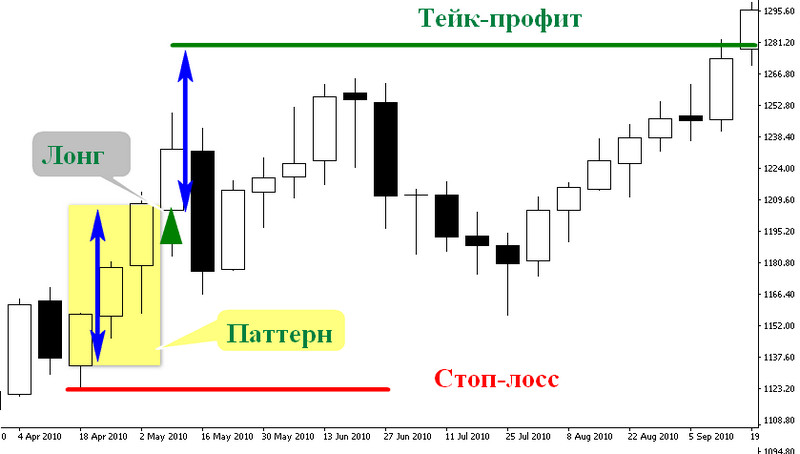
Stop loss set immediately after the formation. Fire it would not be very often strategy is very reliable, but sometimes it happens. Take-profit set at a distance equal to formation. The result is that stop loss and take profit in the strategy “Philosopher” correspond roughly 1: 1. You can, of course, experiment with your own variants, but this approach is most effective in terms of winrate.
If after testing the signal, once again we see three candles in a row in the same direction, then re-log in may be too risky. More reliable if between the two unidirectional signals is at least one opposite candle, the market still need to be adjusted.
If the price almost reached the take profit and began to be adjusted — better to leave. Let the profit will be slightly less but it will still be. This technique not only protects from loss of profit, but stop loss is hit.
Those who use classic Price Action, can also follow a strong levels, and if the price ran into one of them, to go with a smaller profit.
In case, if an opposite signal to the entrance on the strategy formed before our deal was closed on take profit or stop loss, it is better not to argue with the market. Close the current transaction and immediately enter on the new signal. It is normal practice.
Money management strategy

Money management in this system is very important. The strategy uses a large take profit and stop so that the lots should be small. Fortunately, their platform nice allows to organize a competent money management even with a Deposit of $ 100.
Transaction volume should not exceed 1% of the Deposit. Well, for the exact calculation it is most convenient to use the lot calculator under “Tools” on our website.
Examples of transactions

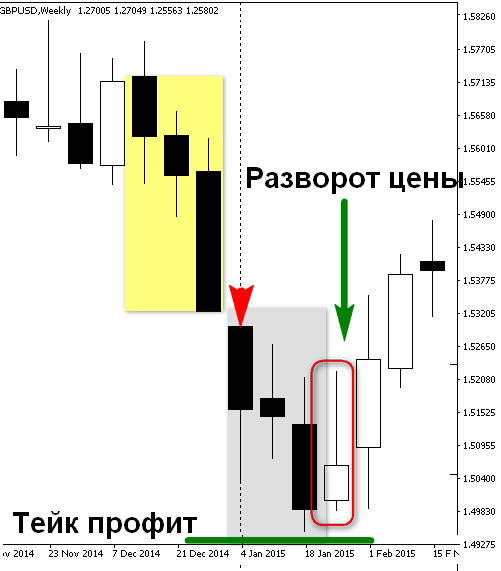
On the weekly quotations of pound formed three bearish candles in a row. Waiting for Monday morning to enter, — quotes are opened with a gap down, but given the target level of TP, equal to 382 PP, the accuracy of the input does not play a big role in the transaction.
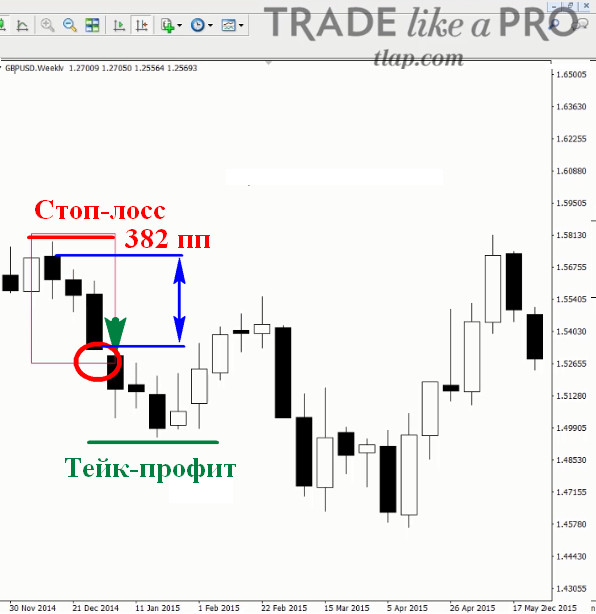
After selling the GBPUSD set a take profit equal to the distance from the closing price Friday to the opening price of the first of the three candle pattern. Stop-loss set slightly above the top of the tail of the first candle.
Despite the long drop, the quotations did not reach take profit. This is the case when you should go out and wait for the sea weather. As described above in the strategy rules, if a candle is visually a bit has not held the tail to the take — out.
The trader, who left the shorts would have to close the deal with a loss due to the occurrence of the opposite signal. Three rising candles light for closing out any opposite positions and open long on GBPUSD.
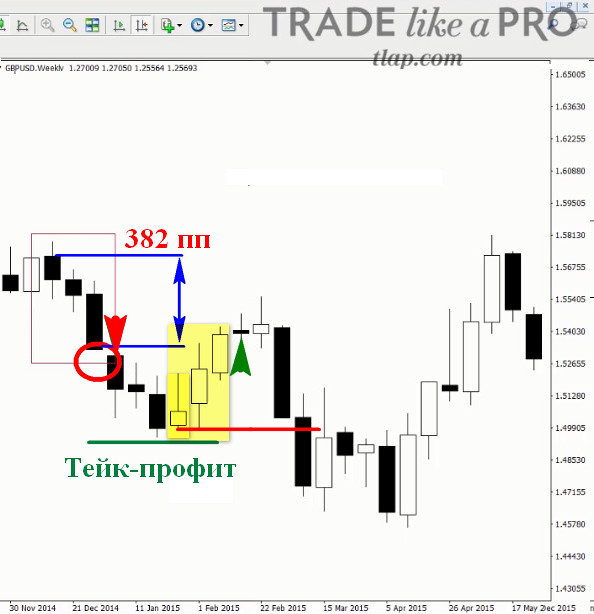
As the graph shows, the pound began to grow, and the transaction closed with a loss by stop loss.
The trading rules do not supersede the principles of technical analysis, which can be seen in another example of the application of the strategy of “Philosopher” in the gold trade. Three candles in a row, the first of which was minimum requirement of the “visible body”, gave the buy signal.
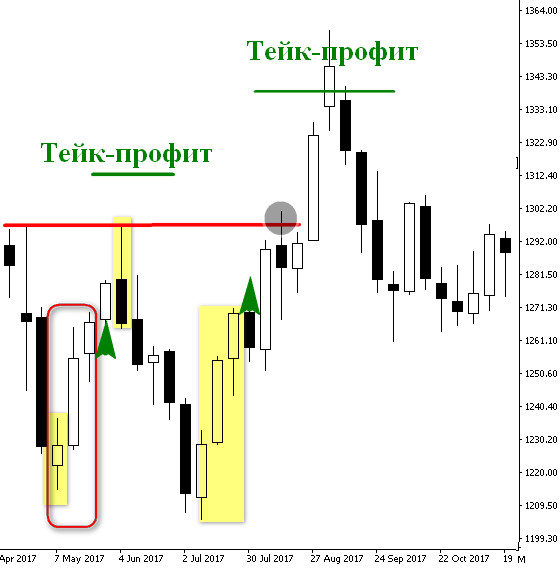
After one week of growth far enough away from the set TP is formed a reversal pin-bar. In favor of fixing the position of said resistance, reversal candles painted pattern “Double top”. A trader would get a stop, if not out of position.
On the same graph later quotes again give a signal to long, but in this case the bulls managed to “puncture” resistance. The next wave of speculators broke the resistance of momentum, and the price eventually reaches our take profit.
Above specifically provides examples of complex cases, because the setup visible to the naked eye, more than simple examples, you can in a large number to find on your own by opening a terminal.
Conclusion

Classic currency pairs strategy works flawlessly. Even in such “wild”, according to some traders, currencies like the pound.
Fit the strategy of “Philosopher” and for use on very aggressive instruments, for example, gold. Stop losses, of course, will break out more often than a “good” instruments, but the trading system continues to be effective.
In addition, the “Philosopher” I absolutely love this flat as three unidirectional candles definitely talk about the end of consolidation and the formation of a trend.