 I greet you, friends!
All who though time faced with trade on the financial markets know what a Moving average. This classic technical indicator is so widespread that is found in virtually every trading system. Even if the design things does not use moving averages directly, most likely, you will find other indicators that use the average in your calculations. Today we talk about the direct use of moving averages in trading systems, tests are the most common strategies for “Makkah”, and make a conclusion — whether to look in the direction of this indicator in today’s markets, or search for the Grail elsewhere)


By indicator you can discover in this article. It will introduce you to the basic options of its calculation and application in practice. Also in this article you can get acquainted with all the variety of types of moving averages that have emerged with the development of technology and, in particular, with the advent of home computers.
Basically, moving averages are used to reduce unwanted noise in time series to the market behavior, underlying the process of pricing became more clear and visible, clearly marked. They provide smoothing of the data. As smoothing method, moving average is a specific low-pass filter, passing low frequency activity and inhibiting high frequency of rapidly varying processes. On the price chart of high-frequency processes appear as rapid vertical oscillations, i.e. noise and lower frequencies as more subtle trends or waves.
In addition to the ability to reduce noise in the time series moving averages have the advantage of simplicity, clarity and functionality. However, like any powerful method of filtering or smoothing the data in real time, they have the disadvantage of lag. Although smoothed data is cleaner and therefore more suitable for analysis, there is a lag between the data in the original series and the smoothed data sequence. Such a delay could pose a serious problem in need of fast reactions to events, as is often the case, it is important for traders.
In some cases, the delay is not a problem, for example, in systems where the price line crosses the moving average in fact the price and should beat the average, so this system worked. The delay is more problematic in models where decision-making used pivot points moving average graph or its slope. In such cases, the lag means a delayed response that is likely to lead to unprofitable transactions.
All moving averages smooth the time series using an averaging process. The differences consist only in what the specific weight is assigned to each of the points of summation and how the formula adapts well to the changing conditions. The differences between the types of moving averages are explained by different approaches to the problem of reducing delay and increasing sensitivity.
The types of trading systems based on moving averages


Model trading systems based on moving averages to generate signals to buy or sell based on the ratio between moving average and price or between two (or more) moving averages. There are models trendsmedia and counter-trend.
The most popular models follow the trend behind the market. On the other hand, the model, going against the trend, predict reversals. This does not mean that market models perform worse against-the-trend. Reliable inputs in trend, albeit with delay, are considered more reliable and profitable than trying to predict reversals, which only occasionally occur in the expected time, the global extremum is usually one, while local is set.
Trendsmedia methods of generating trading signals based on moving averages can be implemented in various ways. One of the simplest models based on crossing moving averages the trader buys when prices rise above the moving average, and sells when prices fall below it.
Instead of waiting for crossing the line and the average price you can use a quick average and its intersection with the slower. A buy signal occurs when the fast average rises above the slow, the sell signal is when the fast drops below the slow average. Smoothing of data series through the use of moving averages reduces the number of false intersections and thus reduces the frequency of unprofitable signals.
Another way to use moving averages based on the use of crossing moving average and the moving average is shifted forward with the same settings. In this case, the buy signal occurs when the fast average goes above the original offset, the sell signal is when the original average falls below the offset. By choosing the magnitude of the shifts it is possible to reduce the number of false intersections, reducing the frequency of unprofitable signals. Sometimes using multiple moving averages shifted with different shift and different periods, as, for example, in the alligator by B. Williams or the Ichimoku.
Moving averages can also be used to receive signals sign in against-the-trend systems. Prices often react to a moving line similar to the levels of support and resistance what is the basis for rule: a login rule according to which buy when the price drops to the moving average or cross it from top to bottom, and sell when they rise before him, or crossing upwards. It is assumed that prices rebound from the level of the moving average changing direction.
What are we testing today?

So, I plan to test some of the classic approaches to the use of moving averages in trading systems:
- price crossing the moving average.
- the intersection of two moving averages;
- using the intersection of moving averages with shear (alligator, and Ichimoku);
- the intersection of price and the shifted moving average.
- multiple moving averages (three, four).
In addition to the experiments with the actual system, we will also speculate on different filters and techniques are designed to improve system performance. And in addition to this information, I chose more than a dozen modern vehicle, based on the moving averages, which are found on various sites and forums online and would like to check out in this article.
So, today we are facing a few questions that we will try to find the answer:
- should I try to create a trading system based on moving averages or this tool is hopelessly outdated?
- what are the best ways of generating trading signals based on moving averages?
- what methods of filtering the generated signals can be applied and in what cases?
- is it worth to pay attention to the current trading system using moving averages basis?
- what types of moving averages most effective and in what cases?
As you can see, the questions are many and we have a very extensive research. However, I believe that the answers are of interest to many traders and will be useful for both novice and experienced traders. It should be noted that this study is conducted for the Forex market for the commodity markets, commodity, stock markets the answers can be radically different.
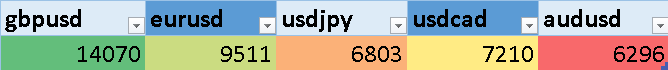
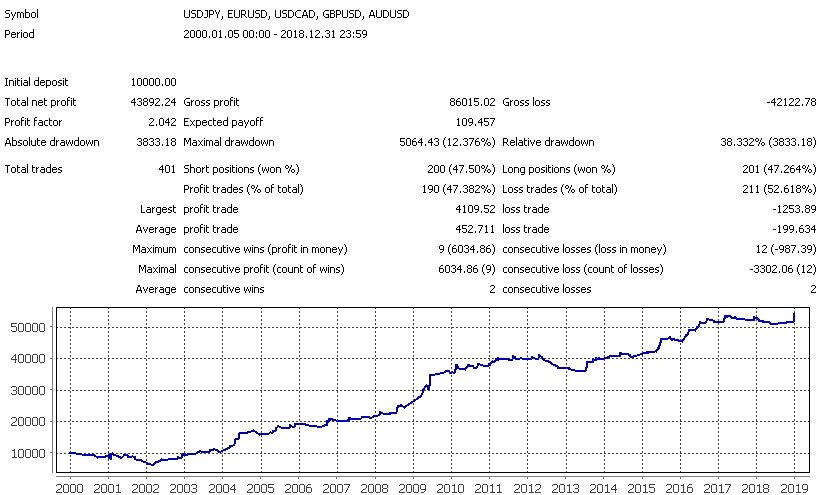
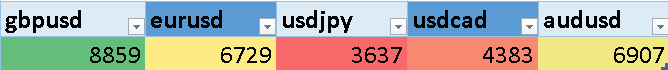
And not to stretch it enough extensive research, I chose just a few currency pairs to study, trying to find them in such a way that the nature of their behavior most different from each other. However, these pairs must be from the group of the most popular. I chose GBPUSD, EURUSD, USDJPY, USDCAD and AUDUSD. I did not include the USDCHF, as it correlates with EURUSD and NZDUSD because of the correlation with the Aussie. Thus, our portfolio includes currency pairs you can traditionally find trending and flat couples with relatively high and low volatility, with sharp and smooth movements inside the day.
The intersection of price and the moving average

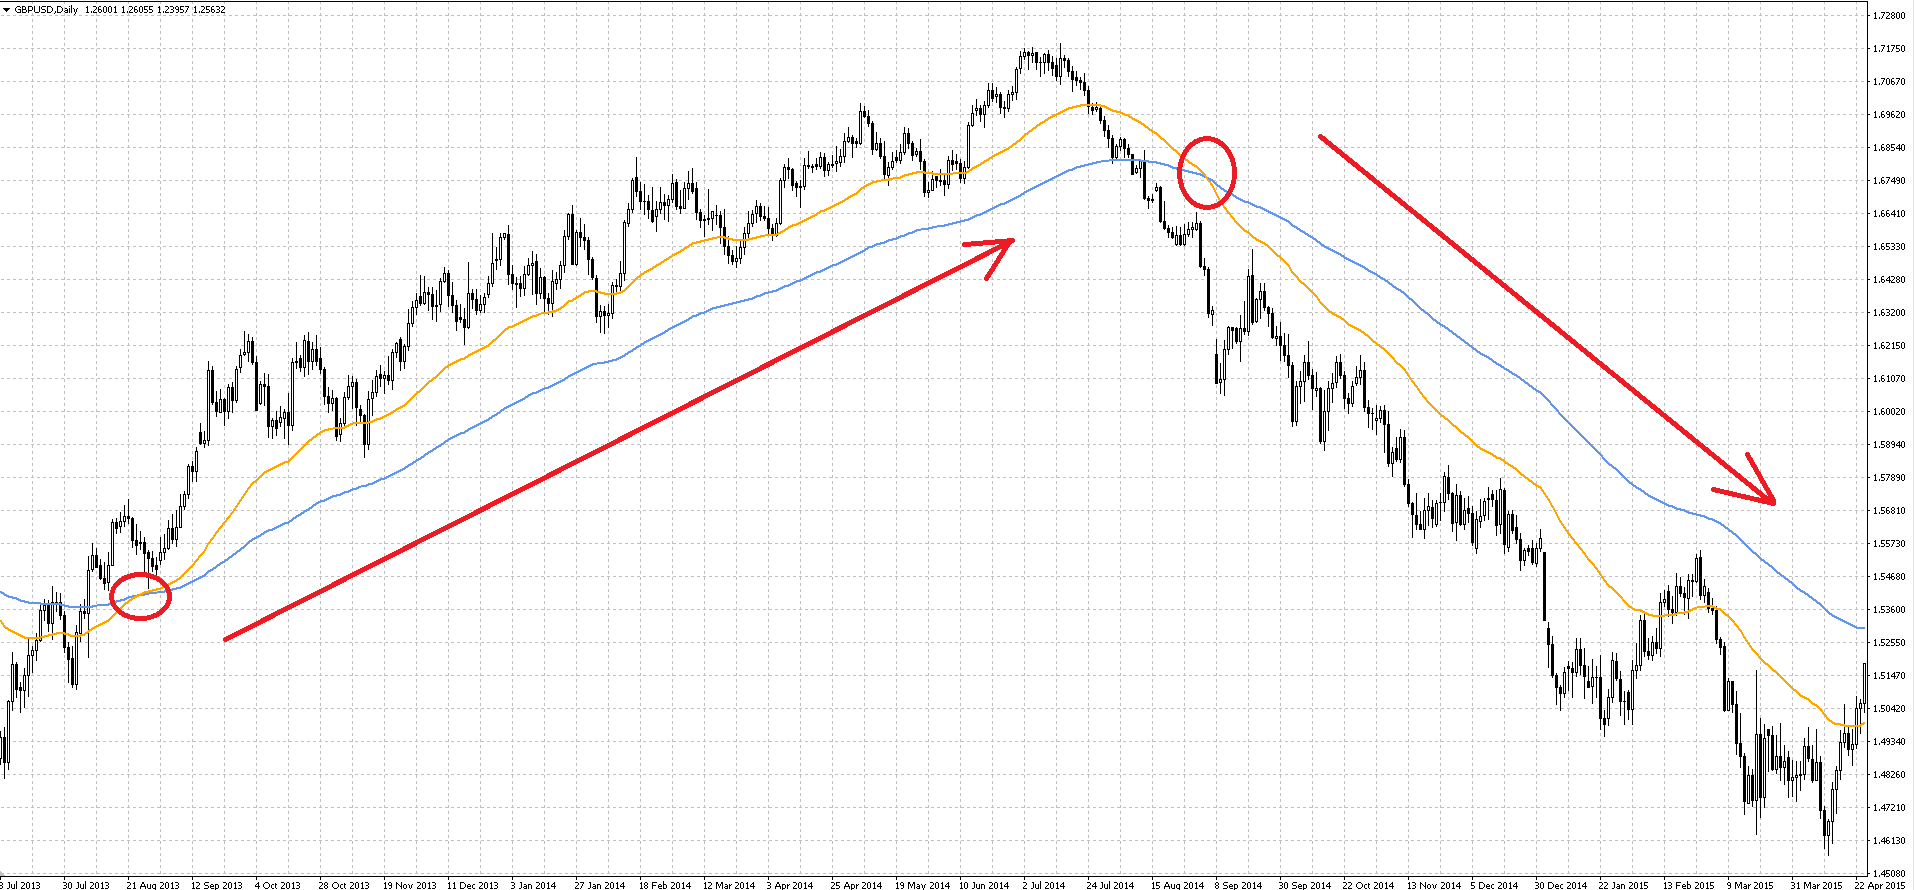
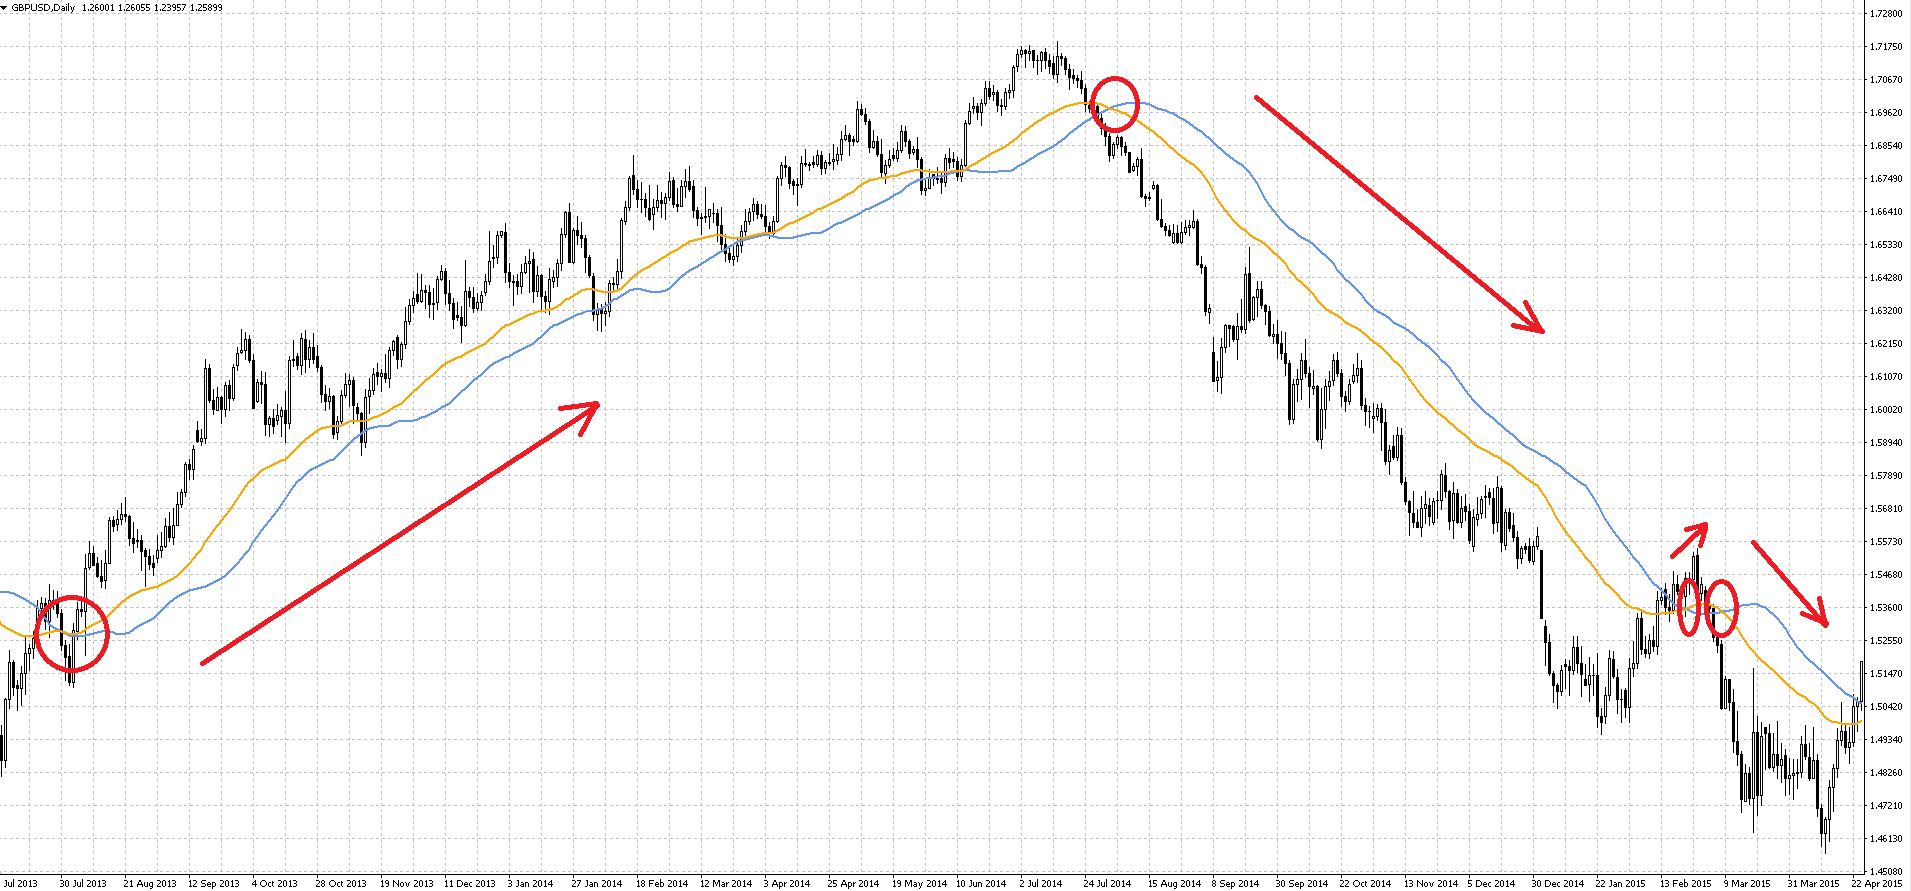
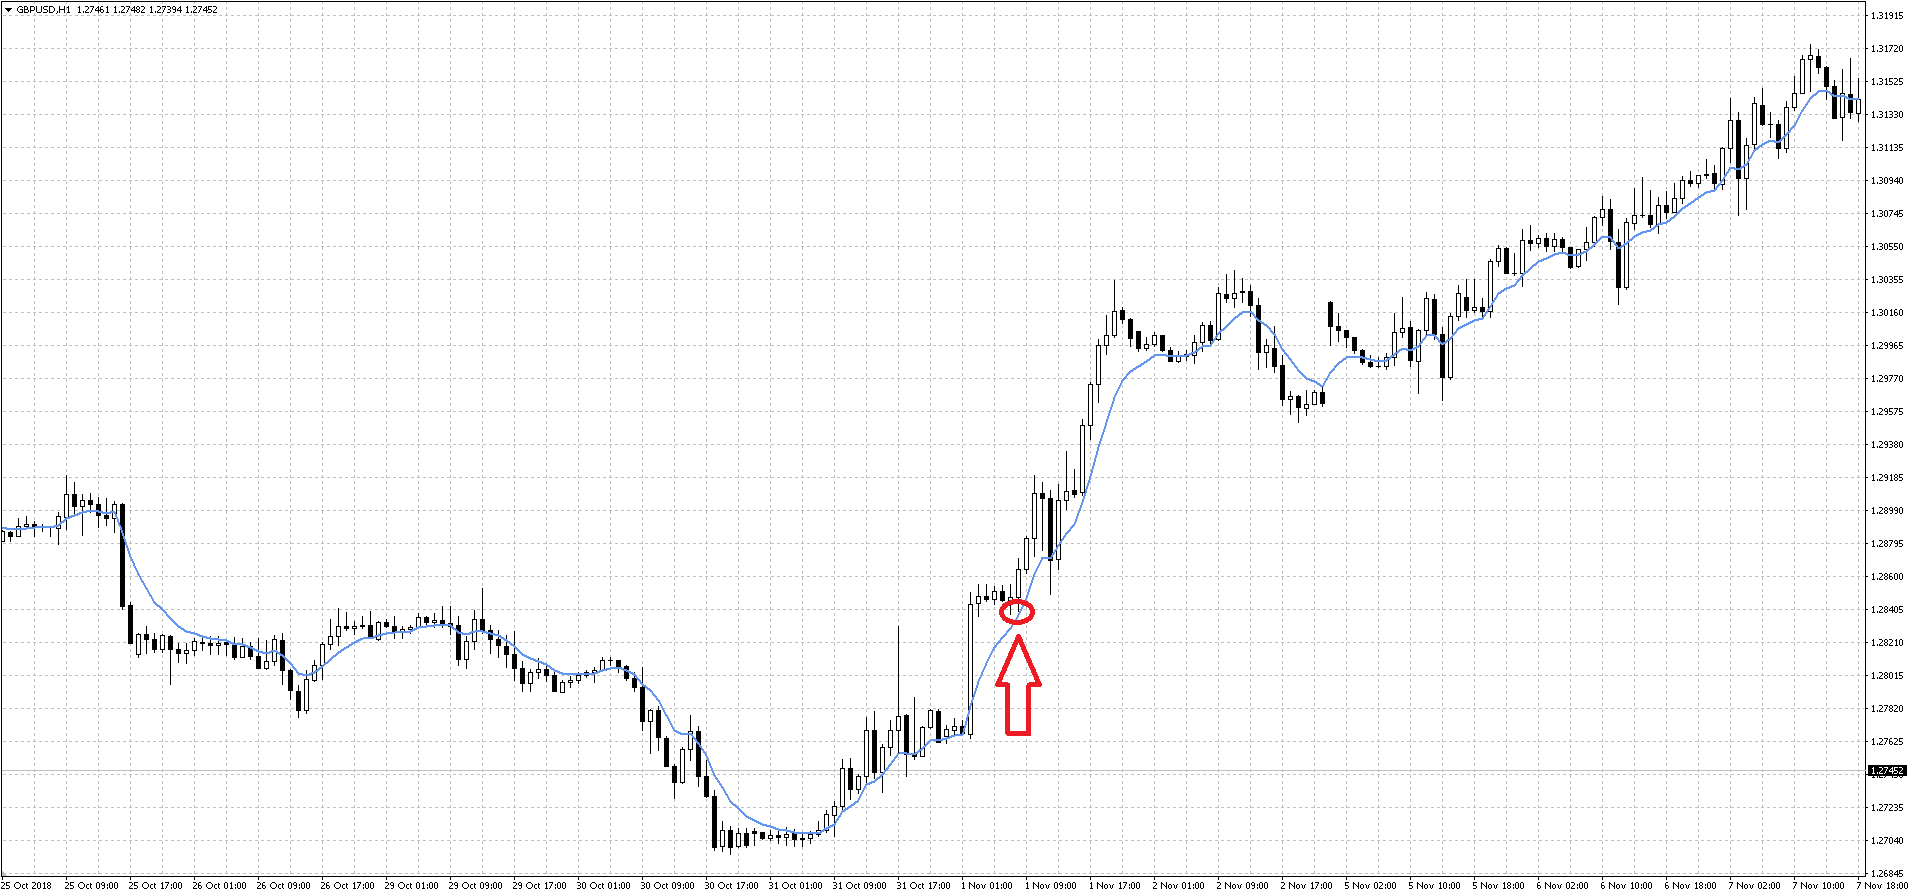
The simplest trading strategy based on using moving averages, based on the use of crossing the moving average price. The basis of this TS is put a simple trading idea: moving average in a trending market priced (due to the principle of the calculation of the moving average). It is therefore considered that if the price is higher than its moving average, the trend is upward, and if the price is under the moving average, the downtrend. Accordingly, if the price crosses its moving average, we can assume that the trend has changed.
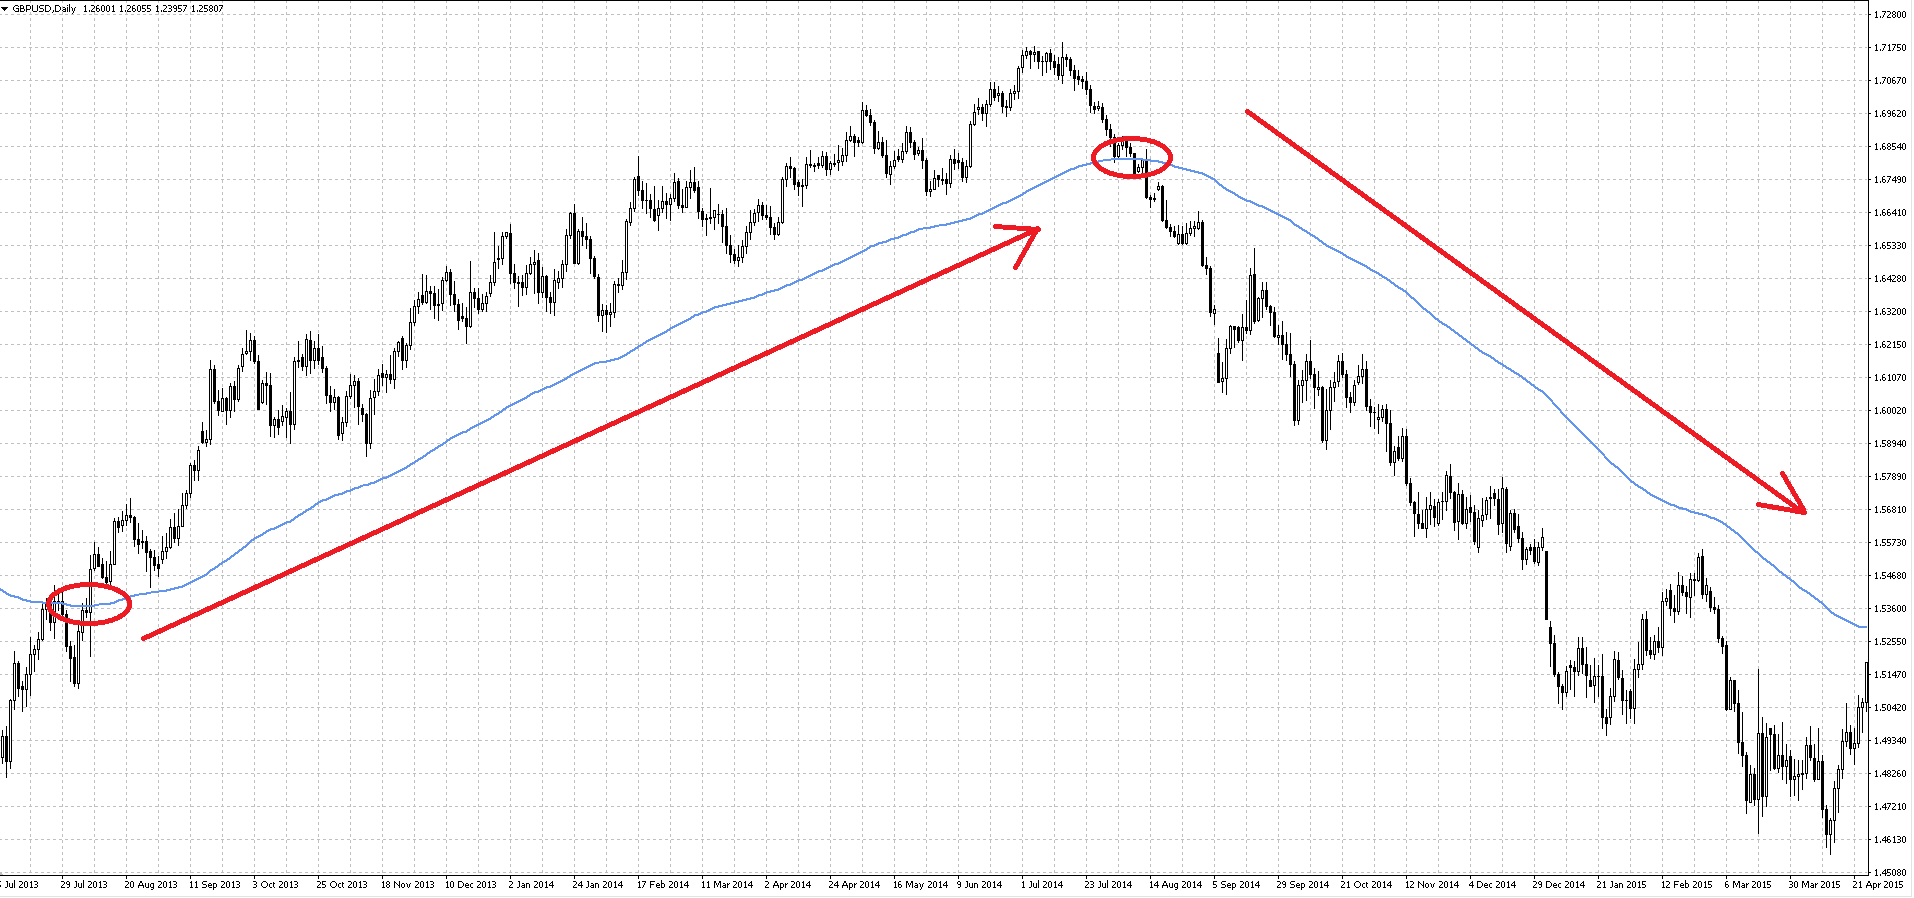 The use of this simple principle and is the basis of a simple trading system based on moving average. Visually looking at the graph, it can be assumed that this approach to trading has the potential to bring us a profit. Theoretically, we can get huge profits with each transaction, receiving profit from most of the trend movements. Only one question remains – whether to take all that profit false signals, which can be a huge amount on pletovy sites? Let’s check it with testing.
The trading system will generate signals for entry when opening day bars on one side of the moving average and closed on the opposite side. The signal output will be generated together with the opposite entry signal. This type of system is called a reversing transaction, will be open all the time, when you receive a new signal will be a closing of the current transaction and opening a new one in the opposite direction.
Any management position, like the trailing stops will not be used. Orders take profit and stop loss also will not be used. In the automatic performance of such a system is dangerous in case I drop the server on which the system is installed, you may incur an unlimited loss. Therefore, the installation of restraining orders (or at least, stop loss) when the real trade is required. But for testing we can this rule be neglected.
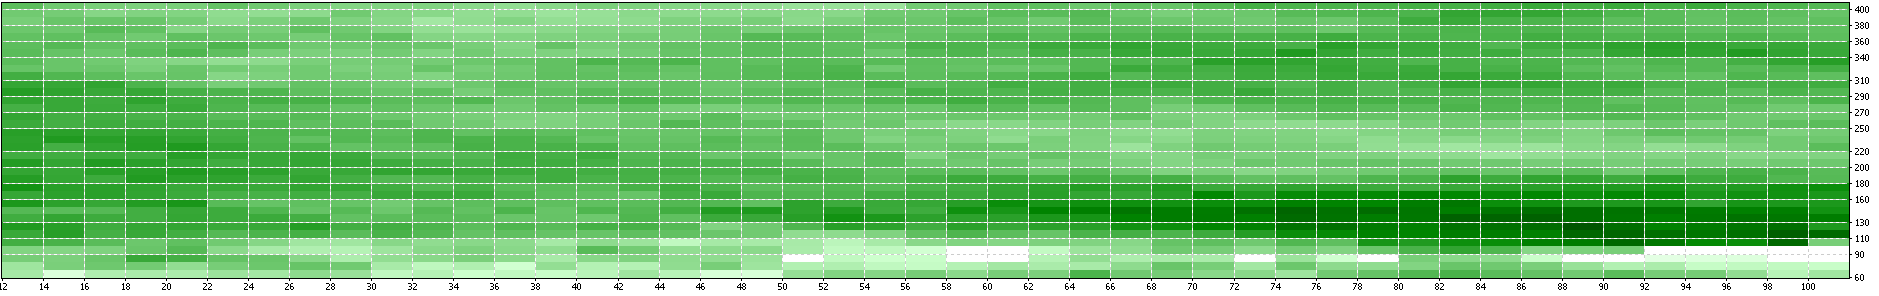
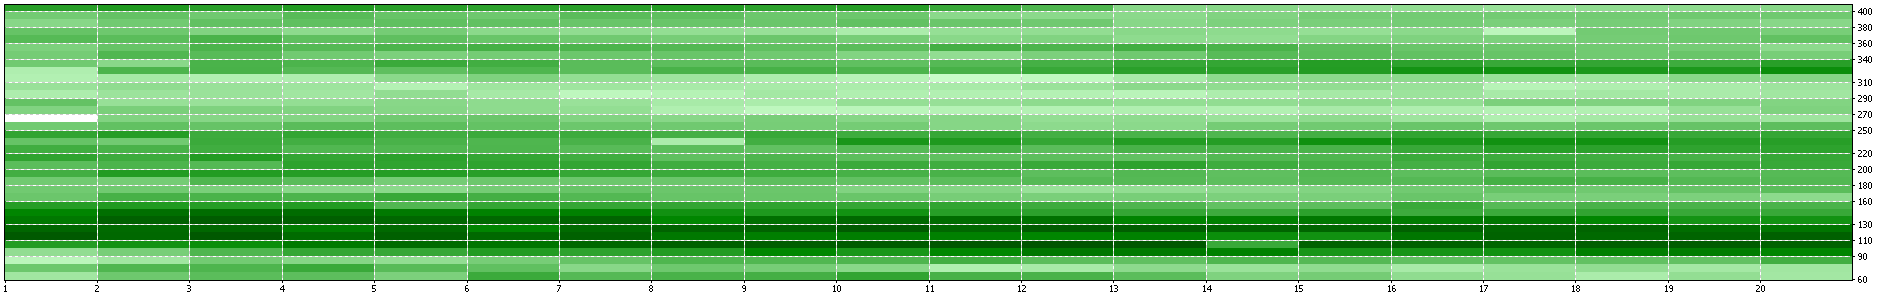
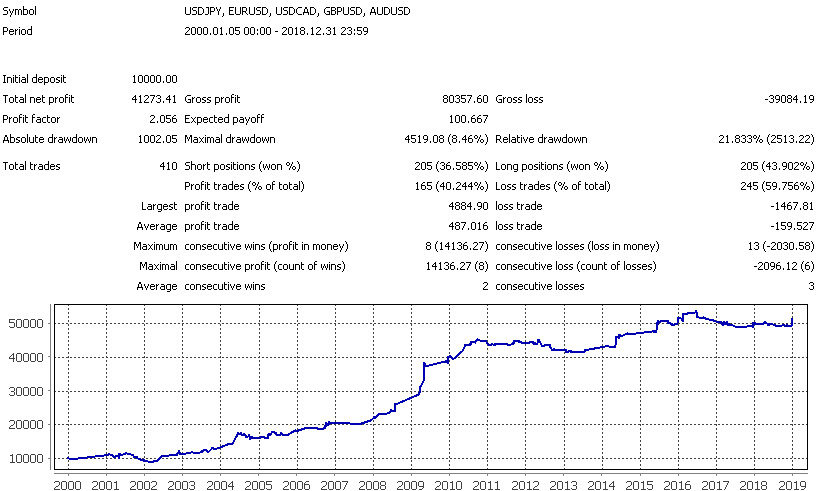
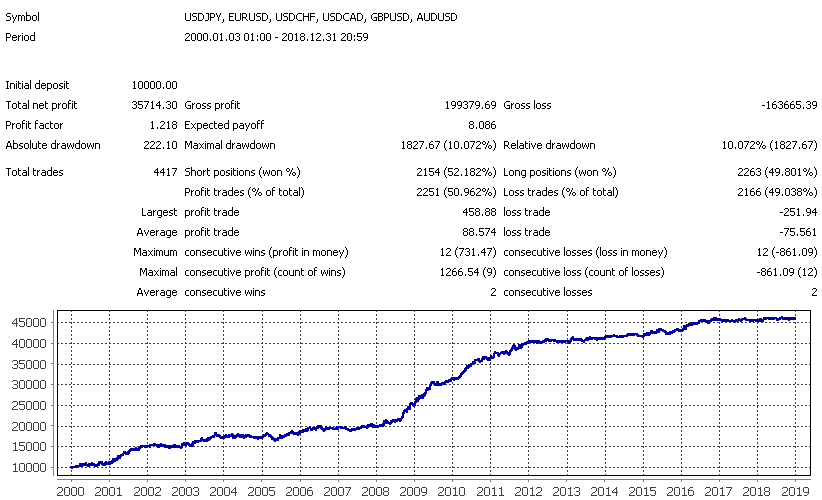
In our basic trading system only one optimizable parameter is the moving average period. Here are the results of one of the optimizations:
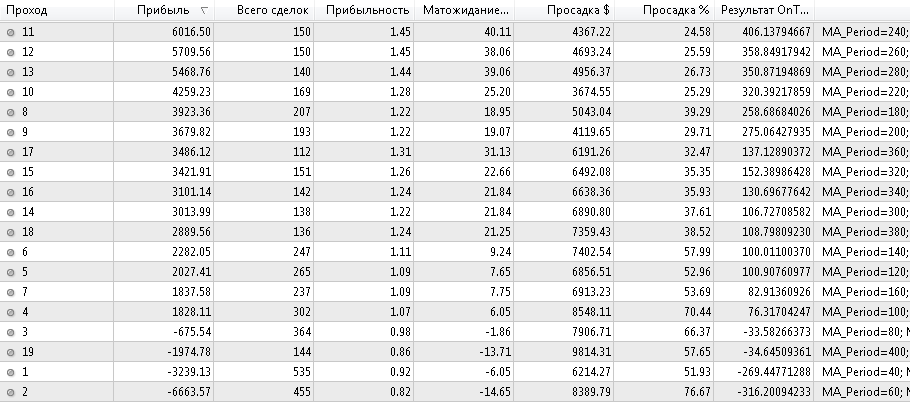 This result, when most of the aisles shows the output in the profit indicates that the system is quite stable and the results are not random. The strategy is indeed profitable for most parameter values the optimization model is operational, and profit is not the result of random coincidence.
Of course, the number of transactions rising period of the moving average decreases, but even at high period (200 and above) remains fairly high (150-200 transactions), to trust the test results. Now let’s more closely examine the optimal results:
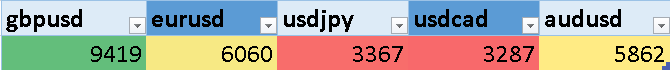
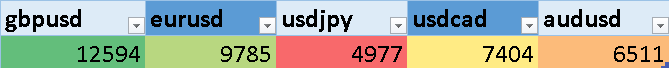
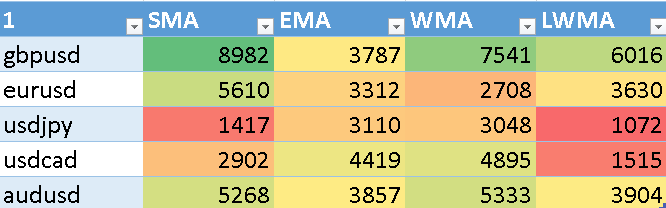 Best of all this strategy works on currency pairs GBPUSD and AUDUSD, regardless of the type of the applied moving average. On a pair USDCAD works better smoothed and the exponential option and the EURUSD simple. The USDJPY has shown low effectiveness of this strategy, however, and the smoothed exponential moving averages work better.
Summary statistics for simple moving average:
 Now try to find suitable filters, which will only use the simple moving average. The most frequently mentioned in the literature the following filters:
— entrance after 1-3 candles, if the signal has not disappeared:
 This filter is in all cases significantly reduced the number of false alarms and increase the ultimate profit of the system;
— entrance after breaking through the middle and passing the price of a certain distance, which depends on the current volatility (ATR). This distance should appear between price and moving average for a certain time, not exceeding the one specified in the settings:
 This filter was less effective than the previous, besides, it weeds out too many transactions.
— admission after break of the moving average, built on the High/Low prices:
 This filter showed an even lower efficiency than the previous one.
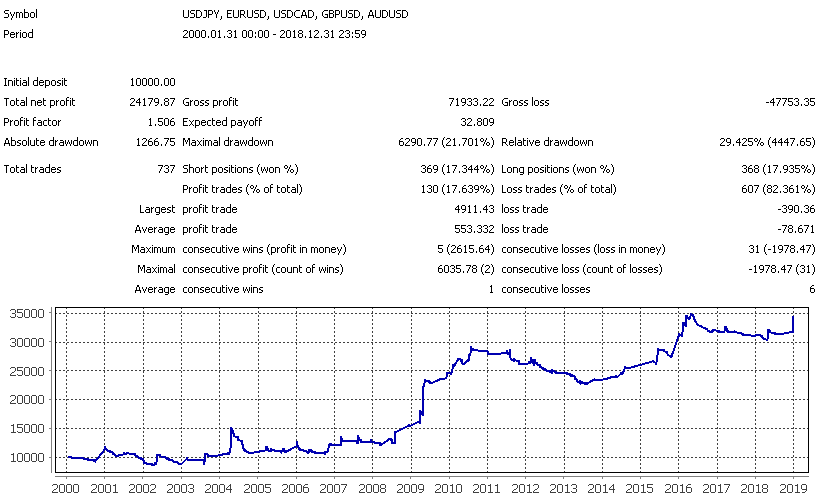
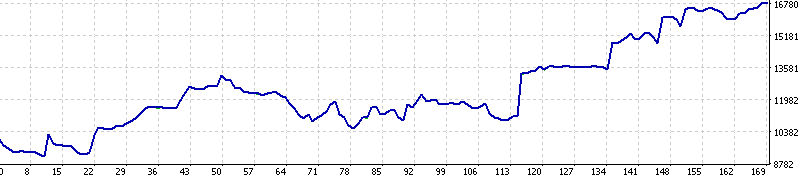
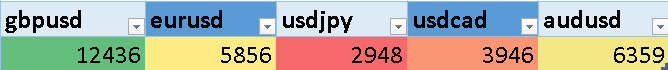
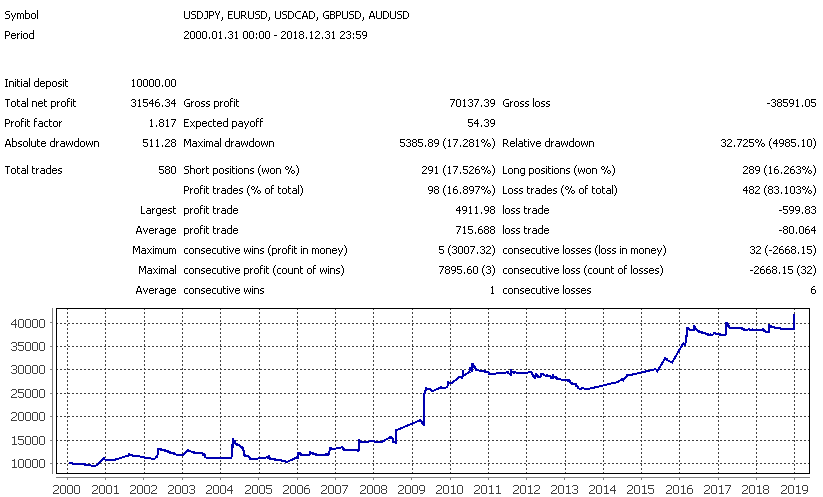
Some of the entry filters do improve the system parameters and their combinations can also give better results. However, the system is a classic trend of TS in which the number of profitable transactions is much less than 50%, and the size of profitable trades exceeds the amount of loss-five times. Such a system is very hard to trade psychologically and to private traders, who are accustomed to more comfortable trade, this system is ill-suited. Typical balance chart has the form of a “ladder”:
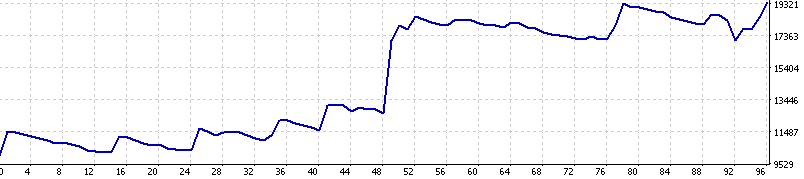 Long drawdown periods combined with the small number of transactions will deliver very tangible discomfort when trading. However, trends exist in the market, and as history shows, they appear quite regularly. This means that such a system will work and earn indefinitely, never losing its relevance. Another thing is that not every trader can stand a drawdown, stretching, say, a decade.
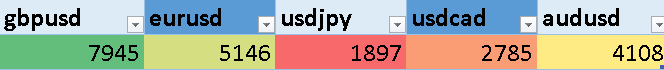
 And finally, in the figure above you can see the overall statistics of a trading system using the most successful entry filter. As you can see, it is far from perfect. In fact, the account was in a drawdown in the period from 2011 to 2015, which can withstand not every currency speculator.
The intersection of two moving averages

In the previous example, we used the simple principle of applying a trading system based on moving average, taken in its purest form and with some filters for the input signals. Yes, essentially it works like most display methods of technical analysis, but the problem, as always, lie in the details and nuances. And one of the nuances of the considered example is the fact that such strategies do not work on markets where there is no pronounced trend. They open up a lot of counter trades on “noise” in price movements, losing the profit accumulated in a trending market areas.
To partially eliminate this drawback by using the intersection of two moving averages, one of which is faster with less period, is a smoothed equivalent of the price chart, and the second, slower, is used to determine trend direction. The choice of the ratio between MA, you can reduce the number of false alarms due to the noise component of price movement, and reduce the number of transactions in the market with sideway trend.
Trading idea for this case is also very simple: if the fast moving average is located above the slow MA, then the trend is upward, and if below — downtrend. Accordingly, the point of intersection of the fast and slow MA are considered to be points of changes of direction of trends and are used as trading signals system:
 Now look at the results:
 As in the previous system, the GBPUSD showing the best results. Also well demonstrated EURUSD. The rest of the currency pair showed approximately the same results, well better than crossing MA price.
In General, most of the results of the optimization are above zero profitability that indicates satisfactory stability of the trading system. The most profitable results for GBPUSD, for example, are obtained by using the fast moving average with a period from 50 to 100 and the slow moving average with a period of 110 to 180.
 A lot of negative values during optimization correspond to parameter sets, where a period of fast moving average is above the slow period, that is, the rules of the system were inverted. In fact, with the right set of settings for the unsuccessful passages will be substantially less.
To avoid this situation will help modification of the rules of the system. Instead of a direct set fast moving average period, we will ask a ratio in the range from 0.01 to 0.99. Then MA_fast_period = MA_coeff * MA_slow_period.
Therefore, the period of fast moving average will never exceed a period of slow.
 We got a very similar picture of the distribution of results, but, this time, unsuccessful passes was much smaller. There were 1,715 results, the negative – about 30%.
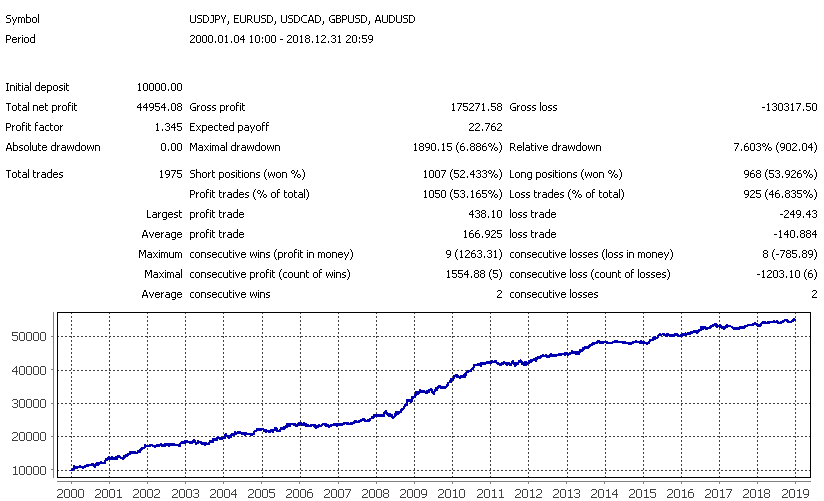
This trading system provides a more comfortable trade, drawdown periods then shorter. Average profitable trade is mostly higher than the average unprofitable in two or three times, and the number of profitable trades is around 40-60% depending on the currency pair. Such statistics already more acceptable for the retail trader:
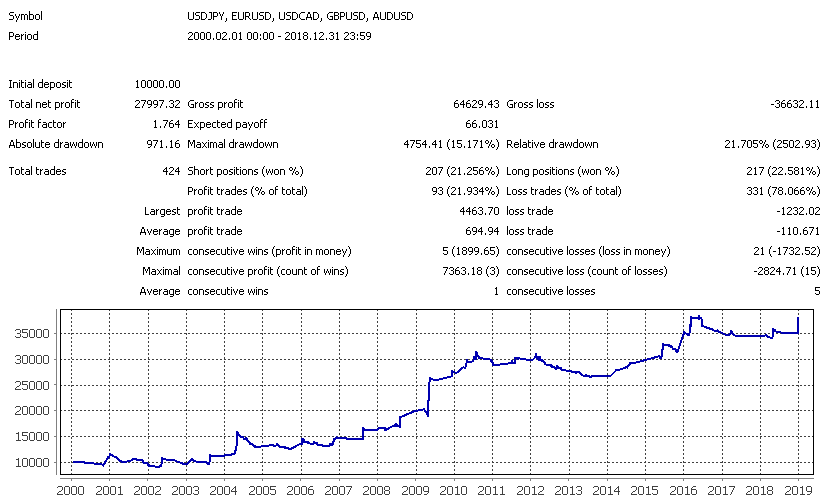
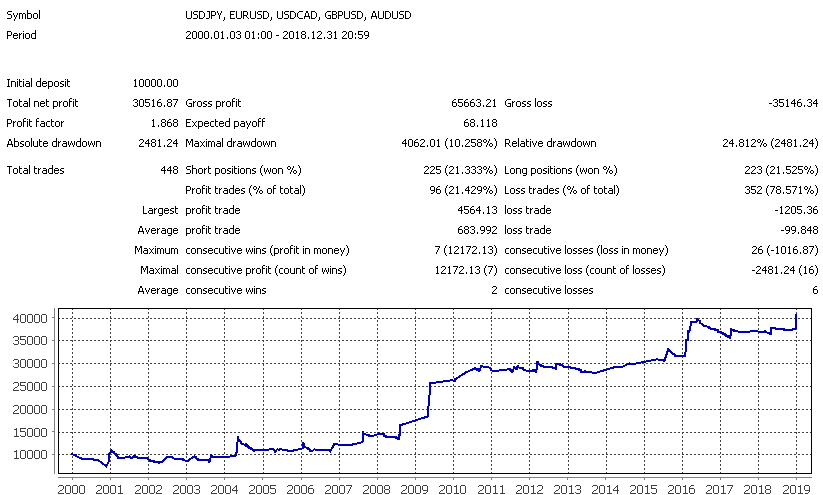
 Thus, if we assemble a portfolio of at least tested me currency pairs, the characteristics of such systems can be quite interesting from the point of view of long-term investment:
 Of course, the drawdown periods are still quite large, but, in General, the results of the system look much better than in the previous case. However, and here we see a very long drawdown period from 2012 to 2014 and mid-2017 at today, and from 2001 to 2003.
The use of moving averages with shift

Another way to use moving averages based on the intersection of MA and shifted forward (backward) moving average with the same settings.
In this case, the buy signal occurs when the original MA rises above the displaced moving average, a sell signal is when the original average falls below the offset. By choosing the magnitude of the shift can reduce the number of false intersections, reducing the frequency of unprofitable signals.
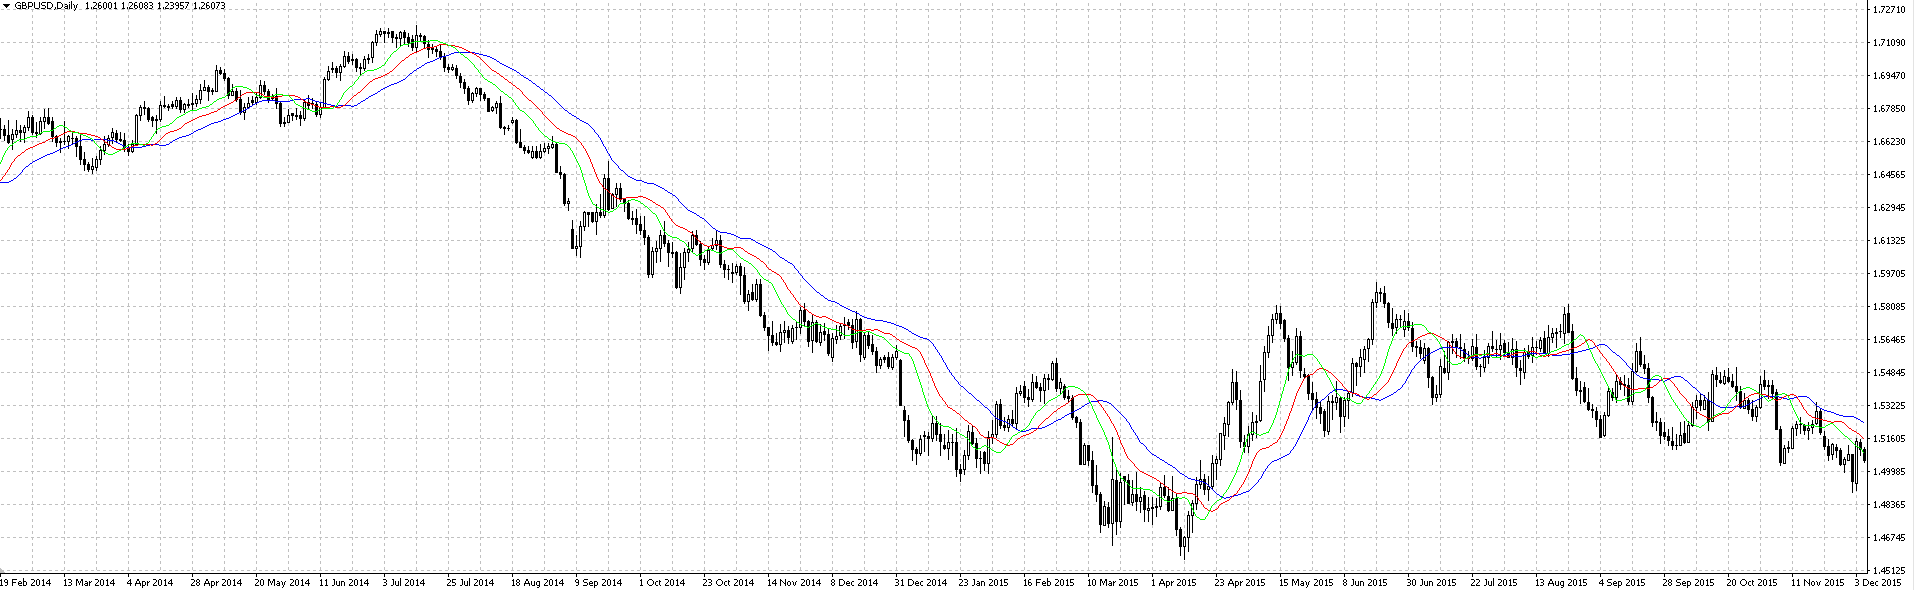
A variant of this method is the method of using the intersection of the price chart with a shifted MA, or the price chart with shifted forward price curve. It should be noted that the last option (used, incidentally, in the popular Ichimoku indicator) represents not that other, as another indicator of momentum. Schedule of rates, together with forward shifted moving averages used in trading system by bill Williams. We consider the intersection of two moving averages with shift and without:
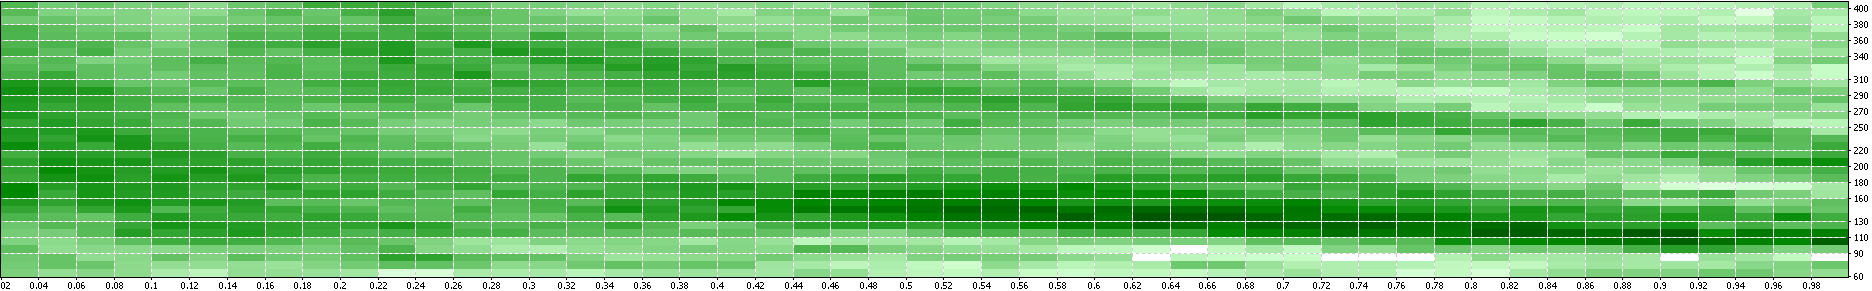
 From the graph below it is evident that whatever the magnitude of the shift, the optimal period from 90 to 150:
 Negative results again within 30%, which is quite acceptable and serves as a signal that the system is sufficiently stable. As for the results of the system, they are not much worse than the work of two moving averages:
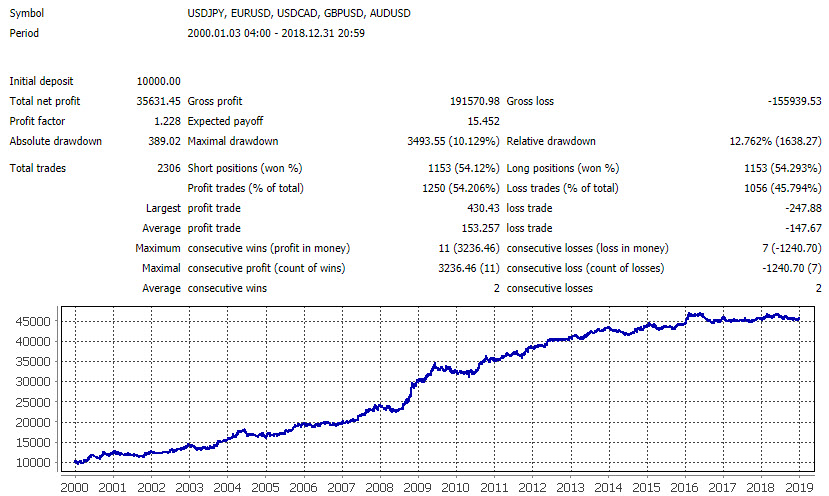
 If you combine in one portfolio all tested currency pairs, we get the following picture:
 The picture is very similar to the result of the crossing of two different moving averages, but the number of profitable trades is lower and the average profitable trade is more than three times greater than average loss. The drawdown periods more protracted. In General, you should prefer the previous trading system.
The intersection of price and the shifted moving average

This option trading strategy consider for the reason that it is used as input signal in a number of trading systems.
Trading idea is slightly different from the previous case. The only difference is that instead of crossing two moving averages, use the intersection of price and the shifted moving average.
For this system we got so many negative results, up to 50%, which may indicate instability of the model. However:
 As you can see, they are comparable with the model of the price crossing single MA without shift. Here’s a summary:
 The system parameters are very similar to the first, we examined the TS. By the way, if you visually compare a summary of all the tests, you will see that the curves yields similar to them – the same periods of growth and same places serious drawdowns. All this suggests that systems based on moving averages and generate very similar signals. They be more effective, sometimes less, but the end result largely depends on the specific settings, and from the behavior of the market.
All this indirectly indicates a fairly high stability of trading systems based on moving averages – if on a particular currency pair most customization when optimizing makes a profit, it doesn’t really matter what one to use. If the market does not change (trends will not disappear, which is unlikely), then the system, with great probability, will bring profit to its owner for a long period of time. How acceptable profit potential for a trader – is another question, but judging by the test results, it has a chance to make many.
With multiple timeframes on the basis of MA

This trading strategy is the equivalent of random crossing the moving average price, but only for several time frames, wherein the temporal scale of the data representation. The essence of trading ideas for this case is as follows: we believe that the market is in an uptrend, if the price is higher than all three moving averages, i.e. that the three trends of varying duration on three multiple time frames represent the data classied as ascending. To do this, we take the H4, D1 and W1 and inflict on them the moving averages with different periods.
The system was very stable, negative results were less than 10% of the total weight. However, the results are not too impressive. Here they are:
 And here are the results of the summary statistics for all tested pairs:
 As can be seen, the results are not much better outcomes first we examined the vehicle.
Trading system based on alligator indicator by bill Williams

Opinions about the books by B. Williams “Trading Chaos and New trading dimensions” in the trading environment is a range from total rejection to enthusiastic veneration. Why not have is indifference, and just about the method books and say what-that they have, at least, to be commended promotional talent B. Williams.
Trading strategy bill Williams is not a mechanical trading system and a trading-analytical complex of a large set of rules and techniques of market analysis and trading operations, in which everyone can create his own trading strategy.
We will consider only one of the elements included in the trading-analytical complex B. Williams and based on the application of a set of shifted moving averages, the so-called “alligator” by bill Williams, and a simple trading strategy that can be built on the basis of this indicator.
 The alligator indicator consists of three shifted moving averages of different period with a different shift, considered together as a single object. The alligator represents not that other, as a set of three shifted moving averages with periods of 9 (shift 3), 15 (shift 5) and 25 (shift
  calculated on the median price chart. Various combinations of mutual arrangement of the schedule of prices and items of the indicator provide guidance to those or other actions on the market. Alligator is very popular especially among beginners. Consider the tests that makes use of Alligator as part of a trading strategy.
Bill Williams, a psychologist, writes vividly and brightly, taking into account the psychology of perception of the text by the reader. Therefore, his books are remembered, especially if they have been read at the stage of initial acquaintance with the market. Alligator, according to Williams, hunts for prey, which is the price. When the Alligator lines are intertwined with the line of the price chart, then the prey is caught, the alligator is well fed and passive. The trader at this point is also in the standby mode.
Using the passivity of the Alligator production – the price starts to slowly slip away from the area indicator lines, the alligator starts to feel hunger, wakes up and opens his mouth trying to catch the elusive prey. First, open the lips of the Alligator green line, then teeth, and finally open jaw – blue line.
The indicator lines are arranged in the order green-red-blue and are moving with the price, yet the trend continues. As the trend can not last forever, sooner or later, the alligator catches up with production and price again falls into the area indicator lines. Process with certain differences is repeated cyclically as the emergence and development of new trends.
The first trade idea, which arises when considering the alligator indicator Williams, is to use it as a trend indicator. If the indicator lines are arranged in the order green-red-blue, it is obvious that the trend is upward, if the order of lines blue-red-green, then a downtrend. Try to test your trading strategy based on order of lines.
For shopping we have identified the simultaneous fulfillment of the conditions that the green line is more red, and more red blue. For sales – the simultaneous fulfillment of the conditions that the green line is less red, less blue and red. The condition for opening positions complete a test of the relationship between the closing price and the red line of the Alligator, to avoid conflict between the rules of opening and closing positions. Optimization will not use, check out the alligator in its original form.
This system gave no positive results:
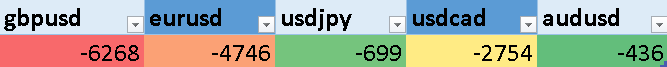 We considered several typical variants of building trading systems based on moving averages, and considered a number of filters for the entry signals. We found several interesting features, such as the strong “similarity” of schedules of balance testing systems.
In addition, we found the answer to most questions. For example, we can say that the moving average is still fairly effective technical analysis tool and that systems based on it can be quite effective. It is best proved system at the intersection of two moving averages, the most effective type of moving average is different for each currency pair.
We considered typical examples do not exhaust all the possible variety of variants of moving averages as trading systems, but they provide a basis for the formalization and study of almost any trading strategies based on moving averages.
In addition, we have only one last question on expediency of research of modern trading systems based on moving averages and freely distributed in the network.
A modern trading system based on moving averages

No matter what the timeframe calculated strategy, we will use H1. Also, we will apply your rules out and follow positions. It unifies the strategy is basically different will be only the rules of entry. Thus we will be able to compare it’s efficiency entering trades.
Window MA

After the breakdown of the price ЕМА8 , it is suggested to wait for the pullback and touch price ЕМА8 for 5-15 candles. If this occurred, a new position in the direction of the initial breakout. It is proposed to set a fixed stop-loss and take-profit, position maintenance is not provided.
The strategy conceived for the M15 timeframe, but we will use it for H1. We also use different rules for the release and support positions. Also some modifications to the rules of the entrance is a candle touched MA, should be directed in the direction of the open position is a small candle filter, which is designed to improve the results of the TS.
 In fact, this strategy is more complicated modification of the classical TS of breakdown of a MA price, filter by the number of candles.
 The strategy has shown itself quite stable and the results are quite suitable for trading. However, the lag is still quite long, and constitute up to one year. Besides, a few years were closed at zero: 2002, 2004, 2007, 2012, 2017. However, the result can be quite acceptable.
Battle of the channels — Battle of the bands

The following strategy is called Battle of the bands. The TC is designed for time plots and uses the channel of two MA, built on the high and low prices. To filter the transactions using moving averages with a period of 100 and 200 sales price should be under them, to do your shopping on them. A trade entry is when price breaks the channel of MA and Parabolic SAR confirms the planned trend. In the original plan to install the stop loss on the opposite side of the canal from MA and a trailing stop value of about 15 points but we, as usual, use your rules out.
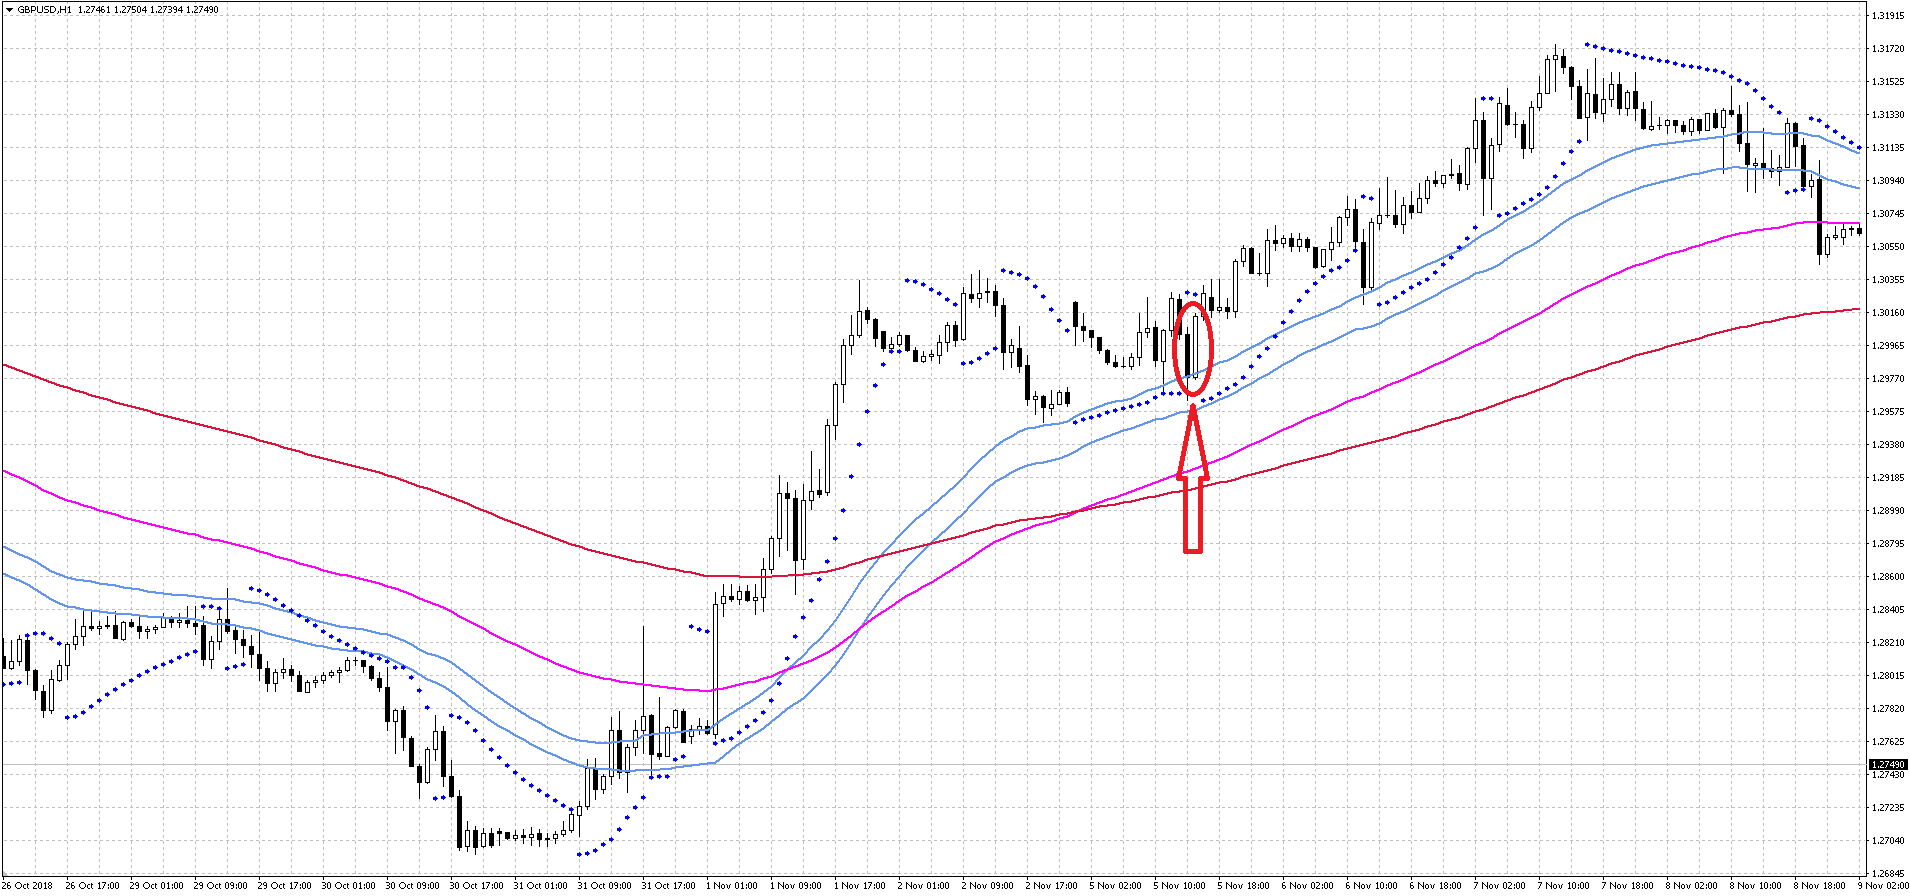 As you can see, the strategy is almost entirely dependent on MA and its rules are pretty simple. Let’s look at the test results:
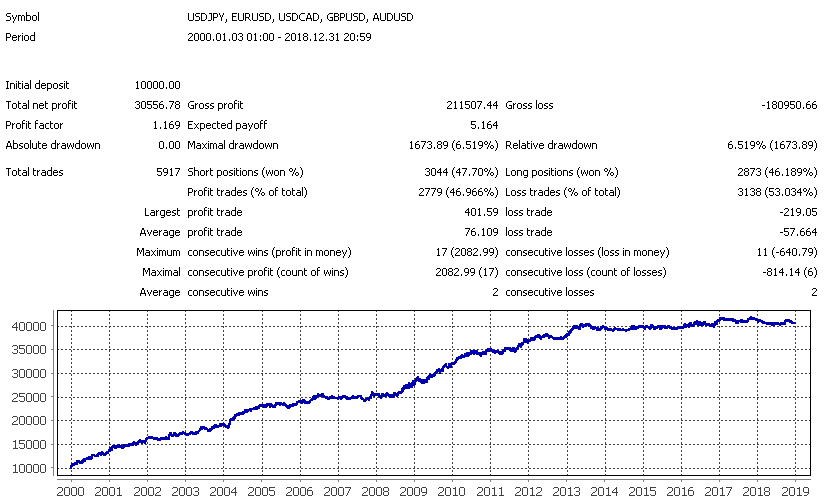 The effectiveness of the strategy declined significantly after 2014, to almost zero. However, it worked for a long time and bring profit. It is likely that with additional modifications, the vehicle may be profitable.
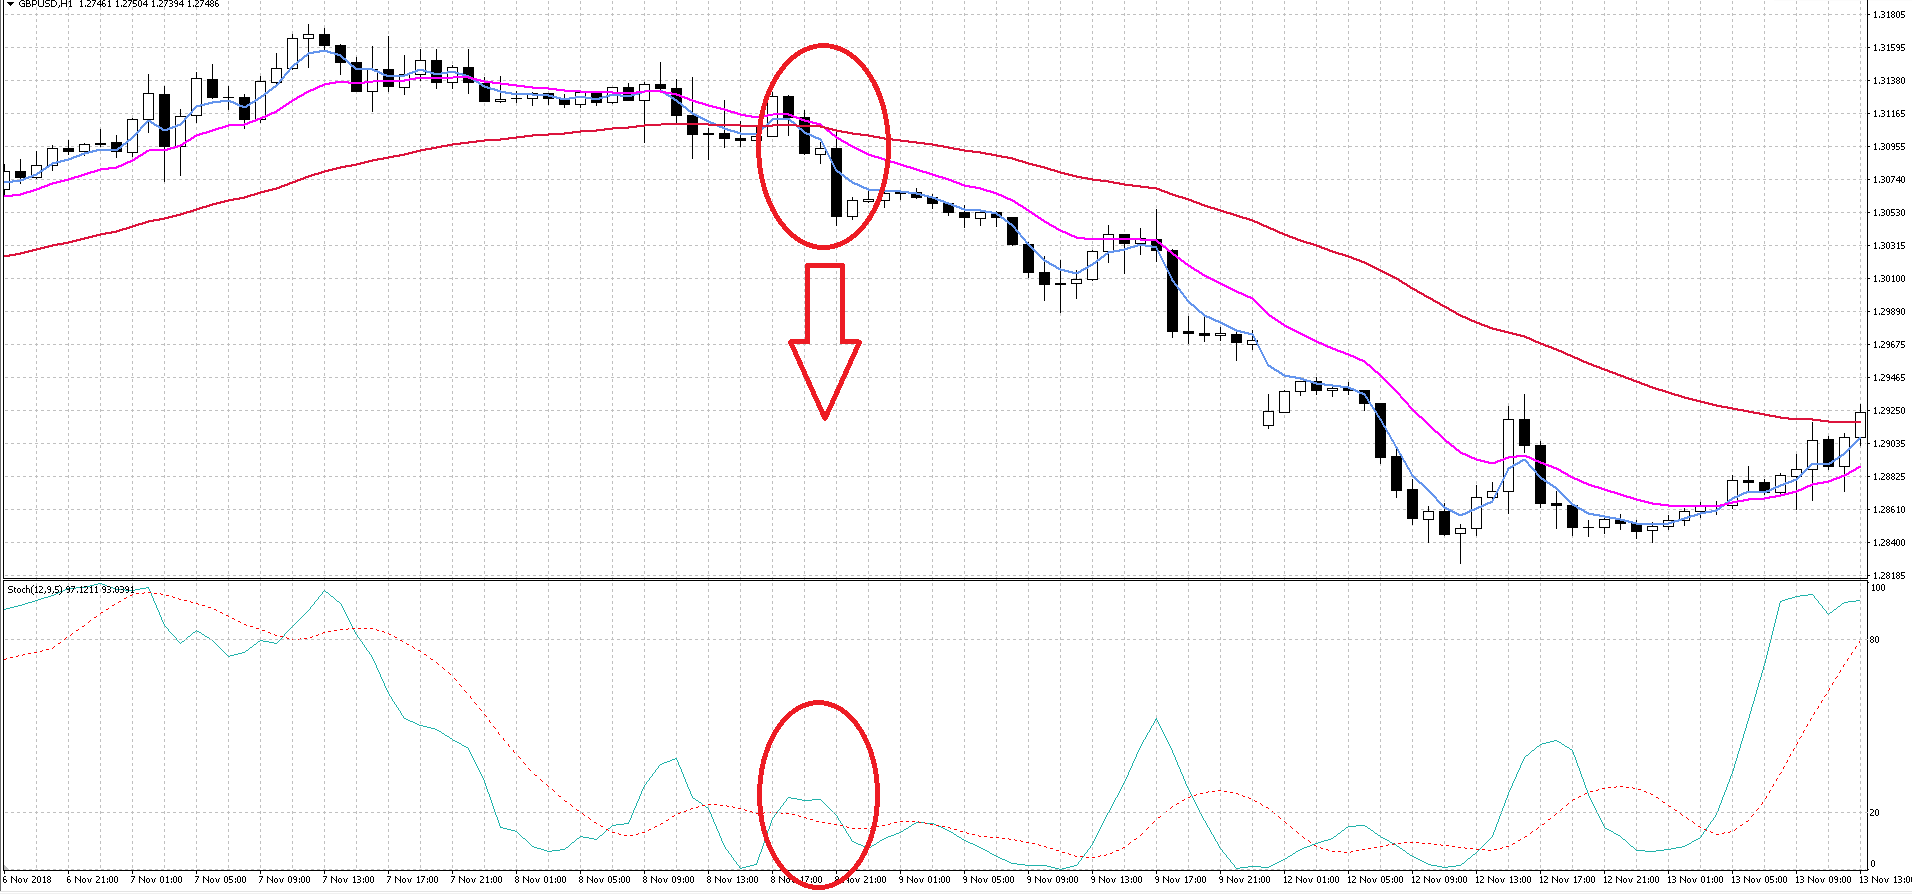
EMA + Stochastic

The following system — EMA + Stochastic. This is another fairly simple strategy that uses three moving averages and the Stochastic oscillator.
The rules are simple and banal. Here is an example for shopping: two fast MA cross slow up and the stochastic is above a certain level. The figure below is an example for sales:
 Now let’s look at the results:
 The system has generated enough trades in order to evaluate its effectiveness. Average profit of a little more than the average loss and the number of profitable trades slightly above 50%. Judging by the curve of the balance of trade is relatively stable, although 2006, 2011 and 2014 were closed around zero. This TC is quite possible to apply on a real account.
Hi-Lo

This strategy uses the moving average channel. The buy signal is crossing the border of the channel faster moving average. An additional filter is the testimony of ADX and candlestick closure outside the channel:
 Let’s look at the results:
 The system has generated enough trades in order to evaluate its effectiveness. Average profit of a little more than the average loss and the number of profitable trades slightly above 50%. Judging by the curve, the balance trade is quite stable, although from 2015, the profitability is almost zero. With some refinement and adding of other system tools you would use on a real account.
Conclusion

As we have seen today, trading systems based on moving averages remain relevant. Judging by the results of our research, on the basis of this indicator it is possible to develop a quite profitable trading system, which can operate stably for a long time to bring profit to its owner.
As the results of our tests, the best option generate entry signals using moving averages is using the intersection of two mašek. This option showed the most smooth yield curve and better statistics compared to the rest of the classic ways to trade moving averages.
In this case the best option filter trades is the expectation of a certain number of candles. If, say, for 3-5 candles of the conditions for entry have not disappeared, such transaction will be successful with greater probability. In addition, you can experiment with filtering trades according to the testimony of various indicators or candlestick patterns, but our task is not included. Therefore give you this possibility.
We also met with several modern trading systems that I randomly chose on the network. They all showed very similar results. The main point that I would like to emphasize, is that three of the four considered systems have lost their relevance in 2015. Rather, it suggests that the authors of the manual trading systems produce hard fit to the market, do not use forward testing and otherwise violate the basic principles of developing sustainable trading systems. It is not surprising that the majority of retail traders lose their deposits, using the trading system, found online and put on live account without thorough testing on a demo.
However, virtually any trading system you can find something interesting – the approach, the principles of support positions, the closing of the transactions or the original methods of filtering the signals. This can be especially useful for the beginners in the Forex market.
Thus, no matter how abused moving averages over lag, over-smoothing and so on, today we have seen that it is quite effective tool that can and should be used in their trading systems.
The theme of the Moving Average on the forum