 Hello, fellow Forex traders.
Today we will analyze the complex trading system Trend System Inside, which is not a Grail, brings 100500% in a day, often catches the foot (which kompensiruet larger profits) and that, if you are trading less than 2-3 years, you can hardly understand.
But it works. This strategy is old school, based on ideas of Larry Williams, Ralph Elliott and Alexander elder. We will penetrate into the very essence of the trend and its corrections, find out WHAT really is the highs and lows of the movement and… maybe you will start to see the market differently. Ready?

Characteristics of strategy
Platform: any
Currency pairs: any
Timeframe: D1+H4
Trading time: around the clock
Recommended brokers: Alpari, RoboForex, Exness
The idea underlying the strategy

In the first lines I would like to Express my gratitude to Anton Zimin (nickname on the forum Anton Zimin), who proposed the algorithm and described the basic rules of the considered vehicle. The branch is actively visited and commented upon in the section discussion of the trading system, traders can learn valuable information practices and some features of the theoretical interpretations.
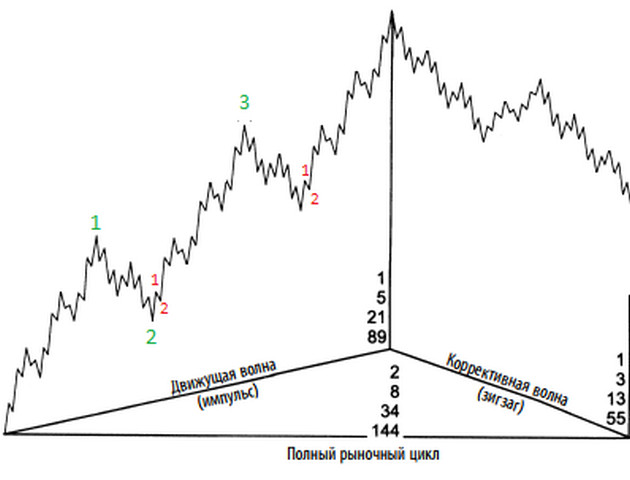
The strategy is based on the basic concept of the trend described for the first time usually trading by Charles Dow, which outlined the directed movement of quotations in the form of a series:
- Highs and lows – when a rising time of the asset price;
- Lower lows and highs during a downward price movement.
Charles Dow, like many of his contemporaries as traders considered trading on the daily time frames, which divide into smaller time intervals lead to another postulate:
- The higher the timeframe, the lower the error probability of trend detection.
Therefore, in strategy the directional movement will be determined by us on the daily candles.

The rules for determining the maximum and minimum taken from the theory of the analysis of the price movement of Larry Williams that outlined in the book “Long term secrets to short-term trade.” We recommend all traders to read this work, by the second edition, which was considerably augmented and revised by the author.
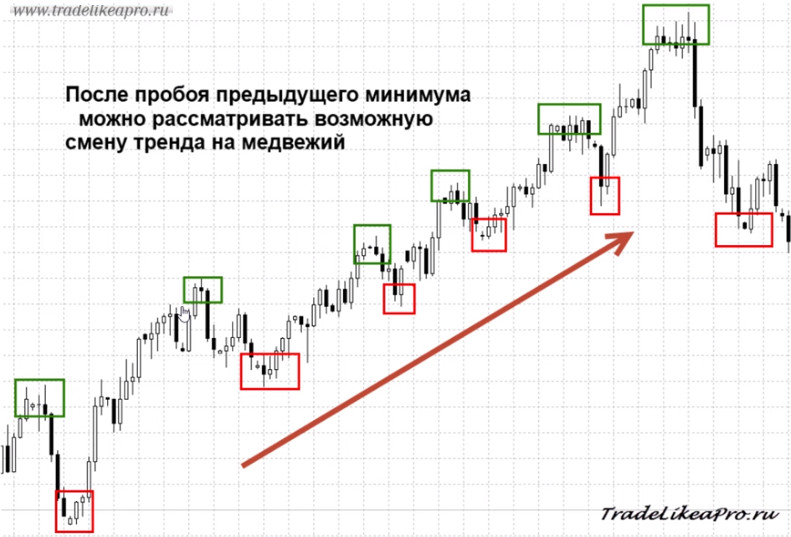
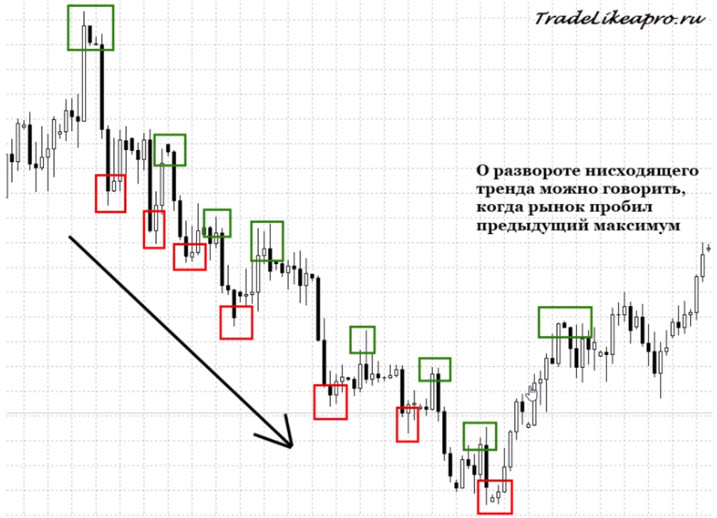
 On the daily chart the highs and lows will be determined by us, as the extrema in formations of three candlesticks and reversals of the market — as the moment when the price settles:
- Below the last low of the uptrend:
- Above the high of the downtrend:
 The time reversal and the birth of a new directional movements – the perfect moment to enter the position. To specify an entry point, use the tactics of the elder who developed the strategy of “Three Screens” from which we take the principle of its search to a smaller timeframe, when a signal at the senior time.
As soon as you determine the trend on the D1 chart switches to the format of the H4 candle, where the trader “waits” correction timeframe in an uptrend, the younger time period.
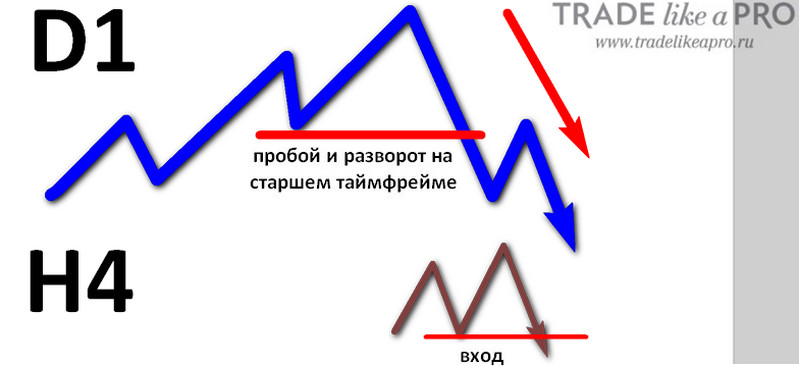 The entrance to the market takes place at the point of reversal of the upward trend of the smaller timeframe — for the example above, it will be a breakthrough of the nearest minimum H4. This tactic allows the trader to advantages:
- The coincidence of the trends of older and younger period;
- The entrance to the third wave.
The latter circumstance increases the chances to make a profit from the principle, discovered by Elliott, who described the wave theory of price movement. According to its tenets – the market is fractal, any interval can be described using the same formations. The development trend is five waves, the third of which is the longest. In it we will try to get in.
 How to determine the highs and lows

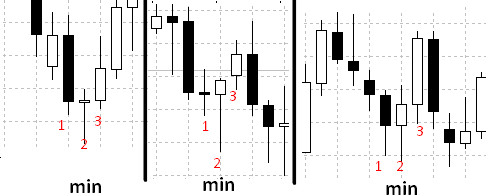
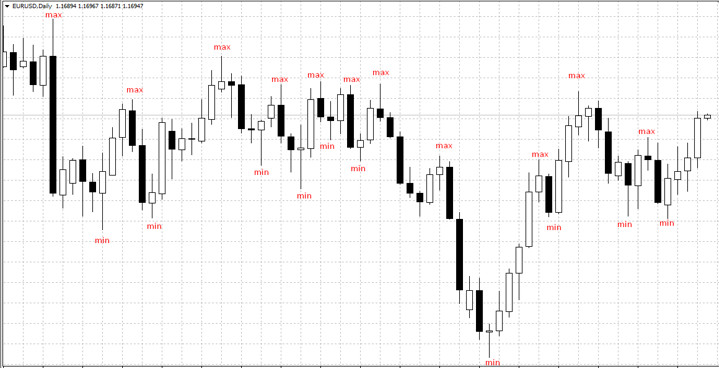
The highs and lows of the trend are determined by the average candle or bar, provided that:
— for a maximum of the market:
- High is a candle or bar on both sides of which candles with lower highs. Also a prerequisite is to update the minimum (break out of the Low point of a candle, which we consider to be high) subsequent candles or bars.
Examples maxima — candle # 2 at all 4 pictures:
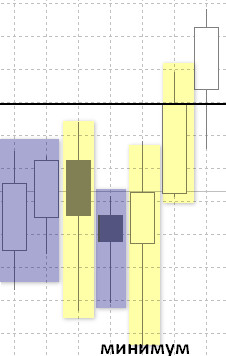
 — for minimum of the market:
- Low is a candle or bar on both sides of which a series of higher lows and educated the subsequent candles or bars be sure to update the maximum (breakdown point of the High of the candle, which we believe is the minimum).
Examples of the lows of the candle number 2 in the picture is a minimum:
 If the current candle (3) failed to exceed High (in the case of a minimum) or Low (in the case of max) previous (2) – emerge from the “shadow” in its price range, we denote it as “internal” and ignored.
While not necessarily “internal” may be only one candle – the idea behind Larry Williams, is a mandatory update of the extremum, to spark “counted”. In the picture below represents the situation when the “inner glow” was preceded by a minimum and not possible to determine the maximum area of the flat:
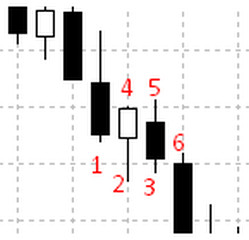
 Despite the fact that the pattern contains three candles, the change of the maximum and minimum possible just with the next candle as shown in the figure below. The first three of price range 1, 2 and 3 form a classic low, but candles 4, 5 and 6 – max. It turns out that a candle under double designation 2 and 4 is replaced by 5, which is considered for this trend is a local maximum.
 To avoid confusion in the definition of extrema, use text labels in MT4 .
 How to determine change of trend on D1

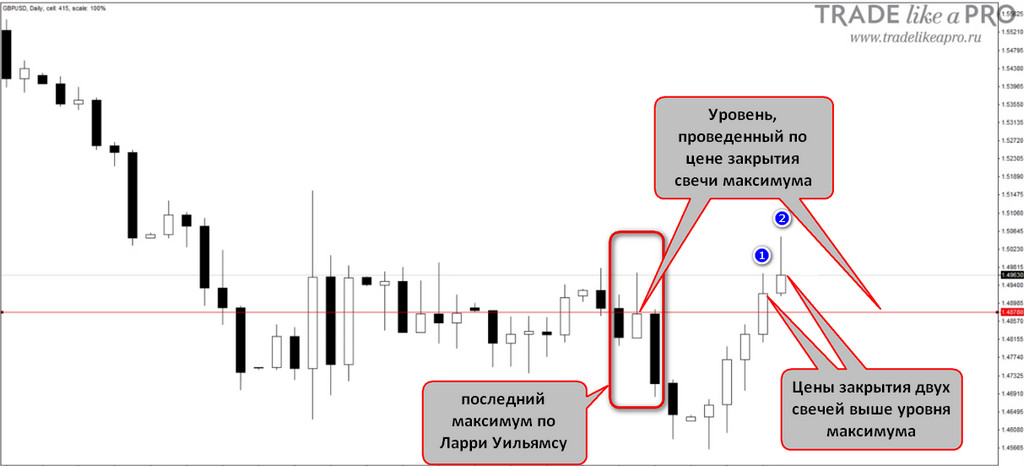
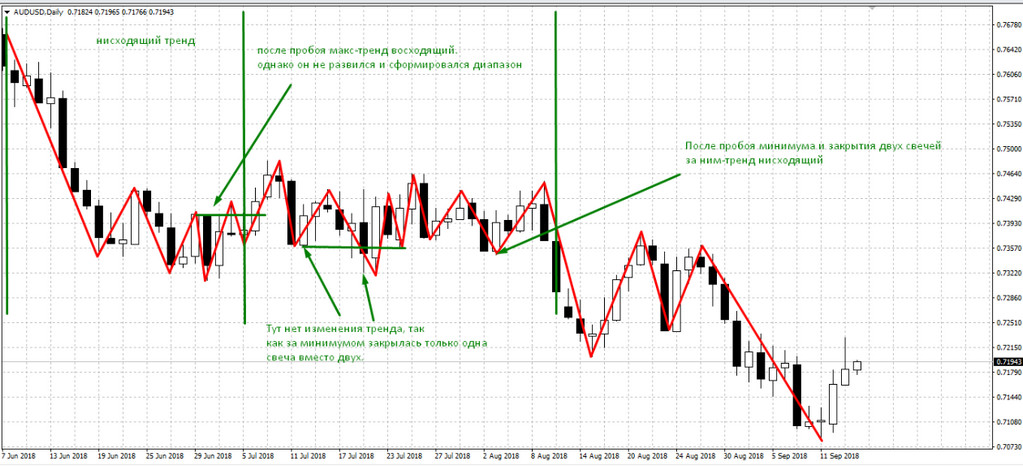
A trend reversal is defined as a breakdown:
- The nearest minimum to change uptrend to downtrend.
- The nearest high when you define a reversal in the direction of growth on a downward trend.
The breakdown is as such, if the close prices of two candles in a row were:
- Above/below the level held on the closing price of the “average” of the last candles high/low, determined by the rule of Larry Williams.
Rules of entry

- On a larger timeframe D1 for the location of highs and lows determine the trend direction. The reversal of the current trend identificireba rule the closing of two candles for the local maximum/minimum (see above):
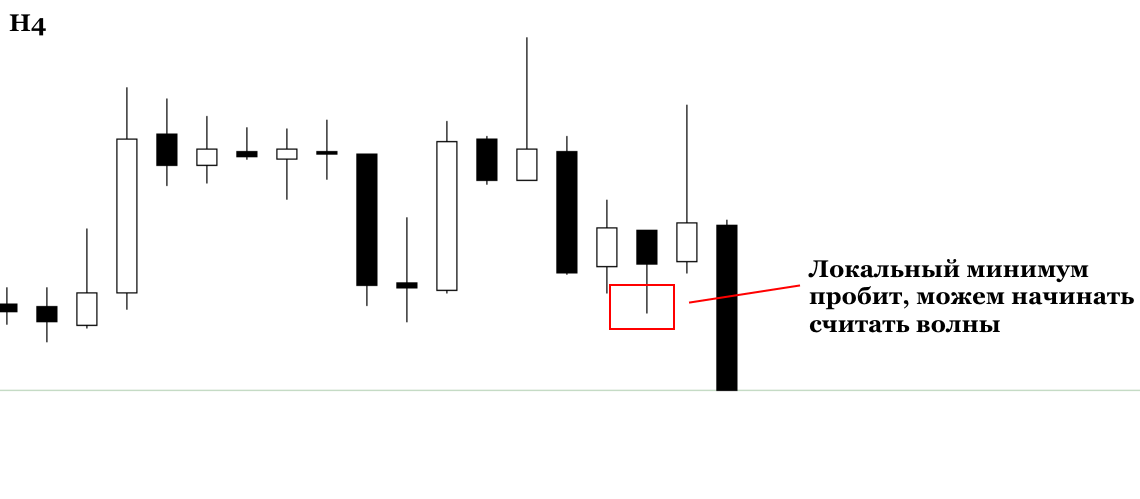
- The work of determining the entry point is on the H4 chart, which should be formed in three waves (in the opposite direction of the daily trend).
On a smaller timeframe the highs and lows of the waves are determined by the rule of Larry Williams, but for a breakdown of the extremum, it is sufficient for exceeding the specified maximum or minimum tail or by the body of the candle. To wait until two candles close, not necessary.
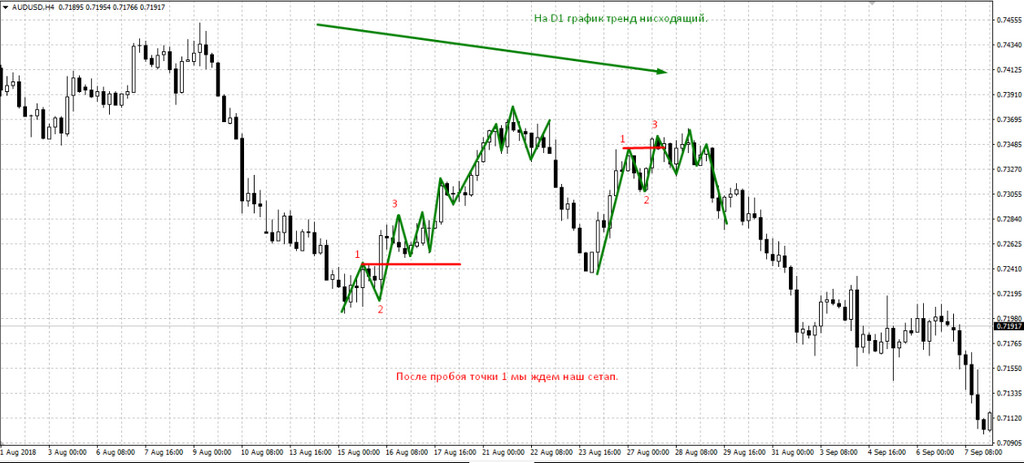
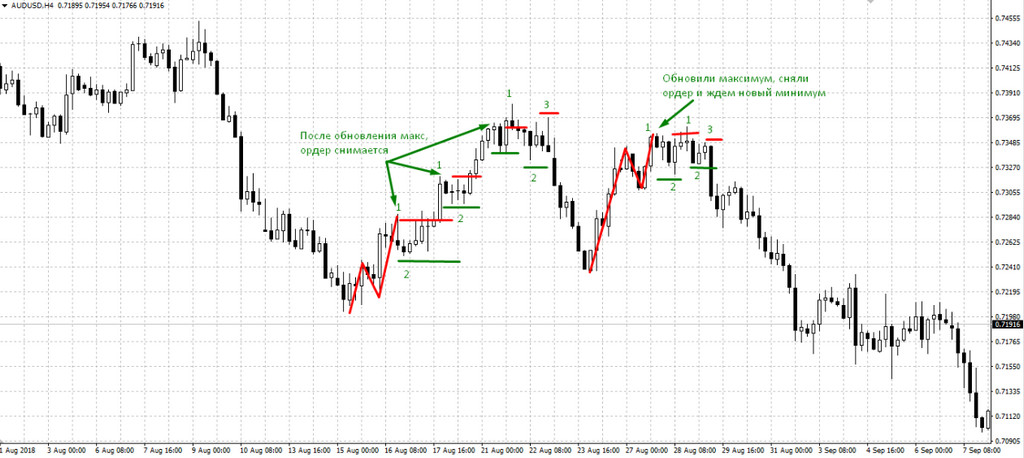
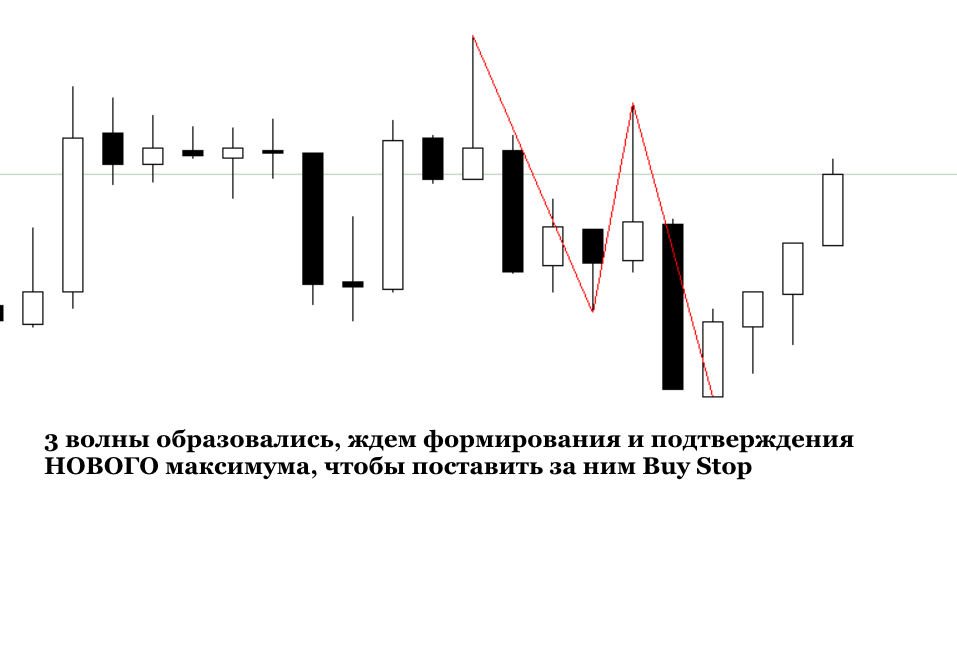
- The formation of three waves serves as a signal about the need to track the new minimum (for entry into sales, if D1 is bear trend) or highs (for logging in to purchase, if D1 bullish trend) in the chart in anticipation of the 1-2-3 pattern formation.
The entrance to the sale is carried out after the formation of the NEW minimum AFTER a pattern of three waves, shopping the same condition, waiting for a NEW high, AFTER three waves against the trend in D1.
In the figure below, the green line shows the pending sell stop orders at the pair with a stop loss (red lines). Orders are placed whenever the formation of a new low (second dot pattern 1-2-3), in a time when “overwritten” the previous maximum.
 Money management strategy, stop-loss and maintenance orders

The worked position is accompanied by trailing stop at local lows and highs of the trend.
- On the daily chart at the entrance of the formation of a new trend in D1:
- In case of entering a trend already developed in D1, at the four-hour chart.
The trader is not recommended to allow the losses in one transaction exceeding 0.5-1% of the allocated for the strategy of Deposit. The lot size can be calculated independently, because the size of the expected loss is known before the trade entry, or calculate using the calculator of the lot on our website in the section “Tools”.
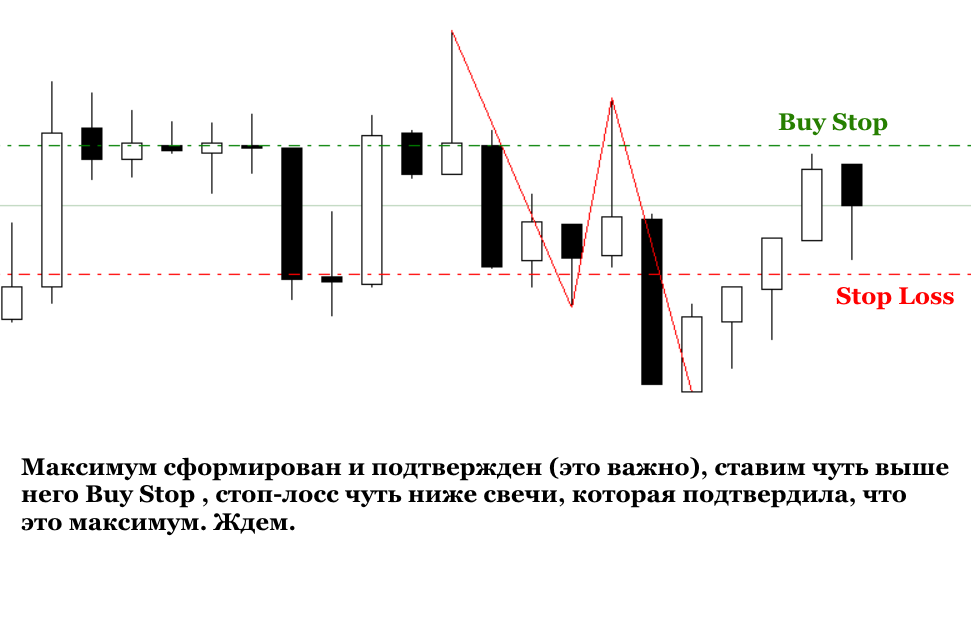
Stop loss we set the bar high updated high low in the case of sales or low of the bar, making a low maximum, in the case of purchases. As a buffer use 5-10 points from min/max.
Examples of strategies

1) review the transaction in the direction of the current trend.
Recall, in the case of entrance into an already established trend, we accompany the transaction (to move the SL) on H4.
On the daily chart and determine the direction designated by the rule Larry Williams minimums and maximums. In this case, it is obvious that the EURUSD is increasing.
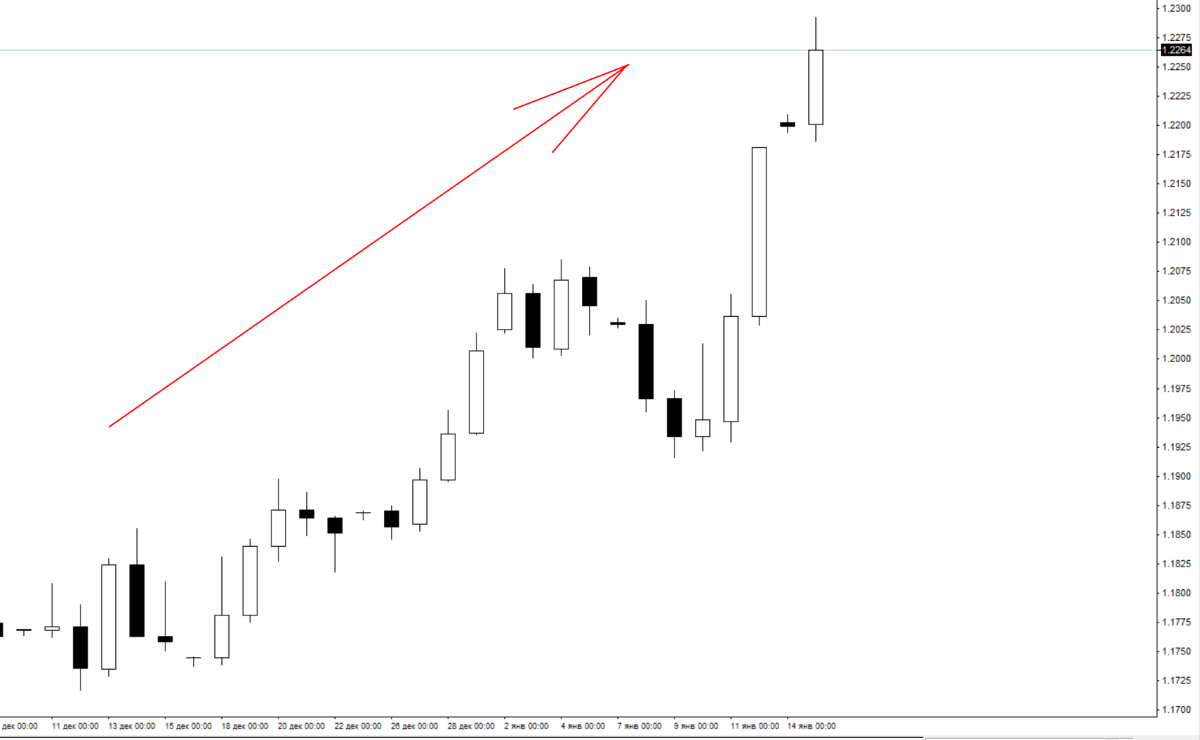 Switching to the H4 waiting for the formation of three waves against the trend in D1, finding out their minimums and maximums rule Larry Williams, and the breakdown of the trend, as usual exceeding the maximum without securing two candles. That is, we expect a trend change to bearish on H4. And only after the breakdown of the local minimum will begin to consider the wave on H4.
 After 3 waves of the bearish trend on the H4, waiting for the formation of a NEW maximum, the maximum of the second wave ignored.
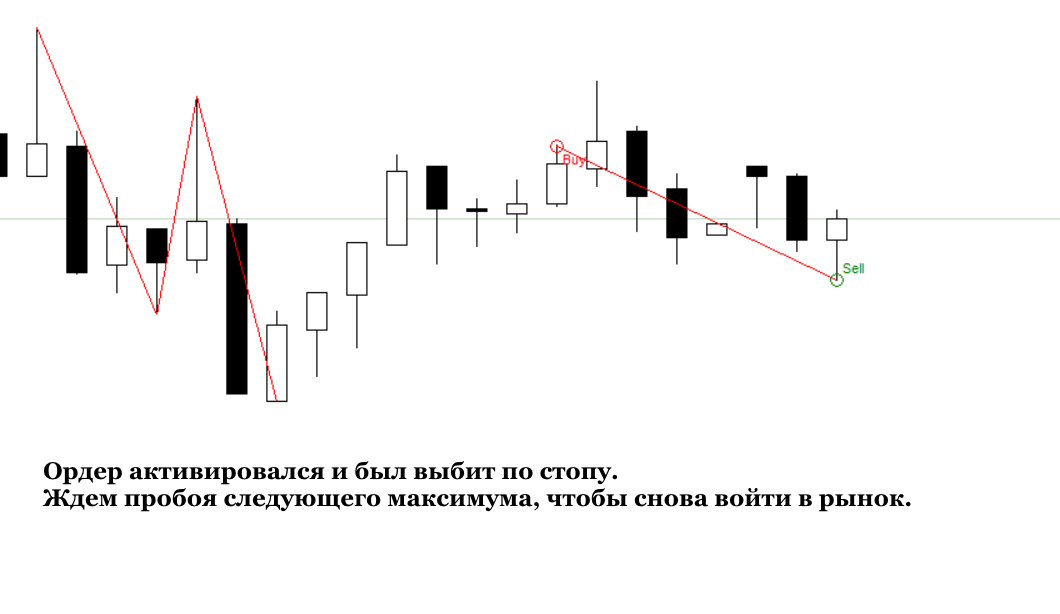
 A warrant was out for a stop. What to do in such cases, provided that the trend on D1 is not changed ? Wait for a new breakdown of local maximum on H4.
 A little later we entered the market and the price moved in our direction.
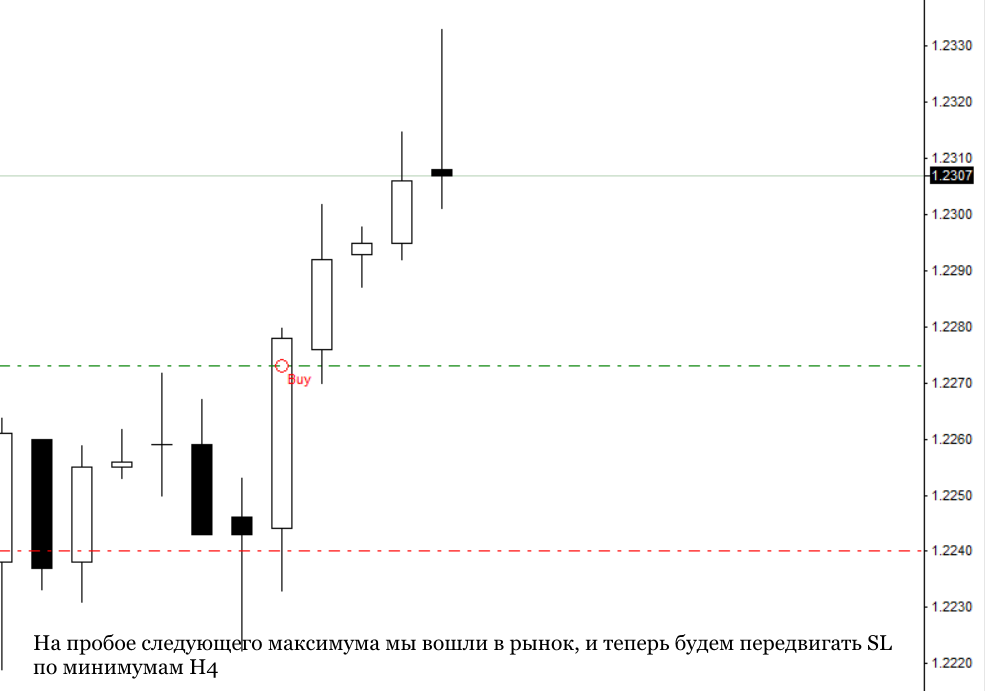 What do we do now? Move Stop loss into positive territory, for every new low on H4.
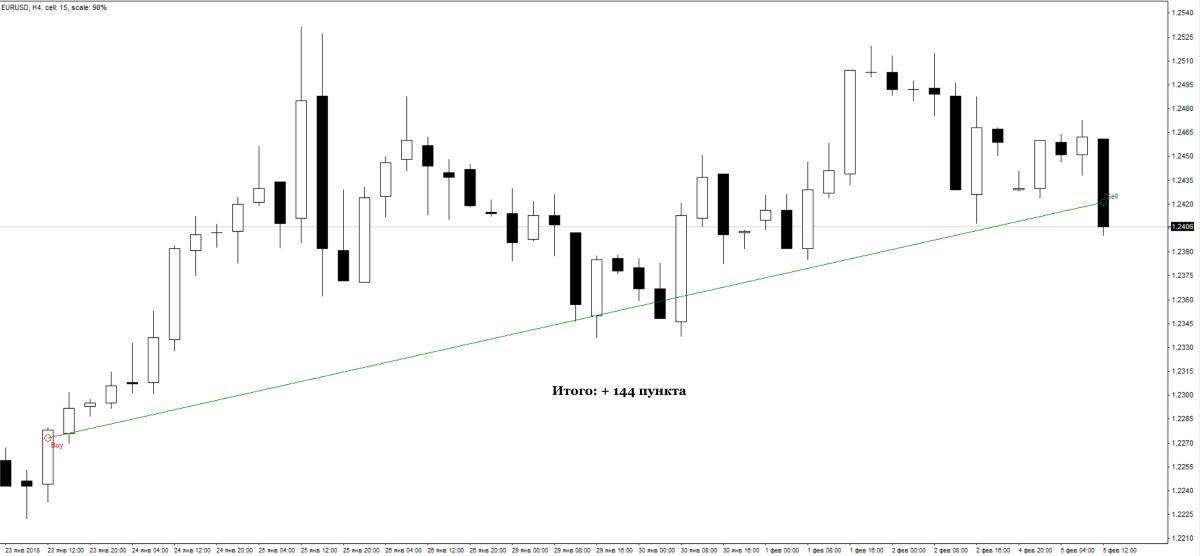 In the end, the deal made + 144 points.
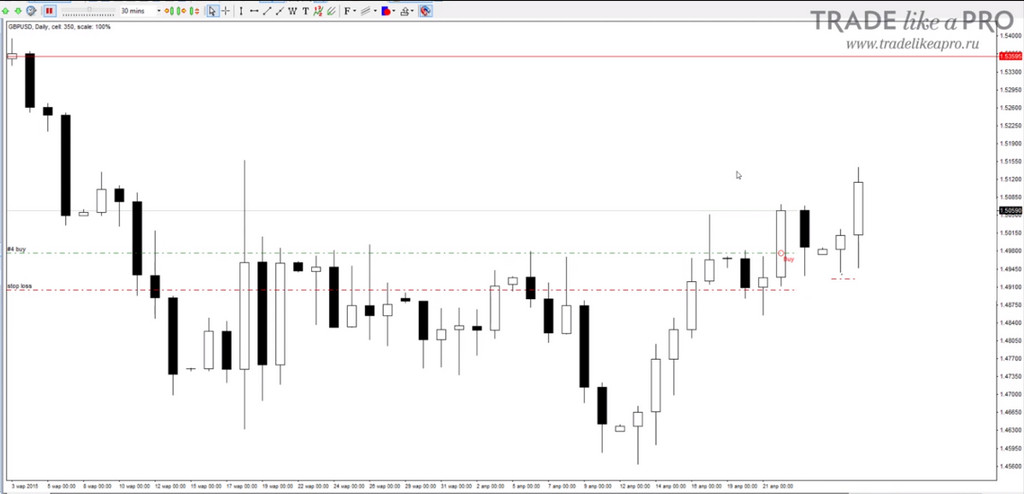
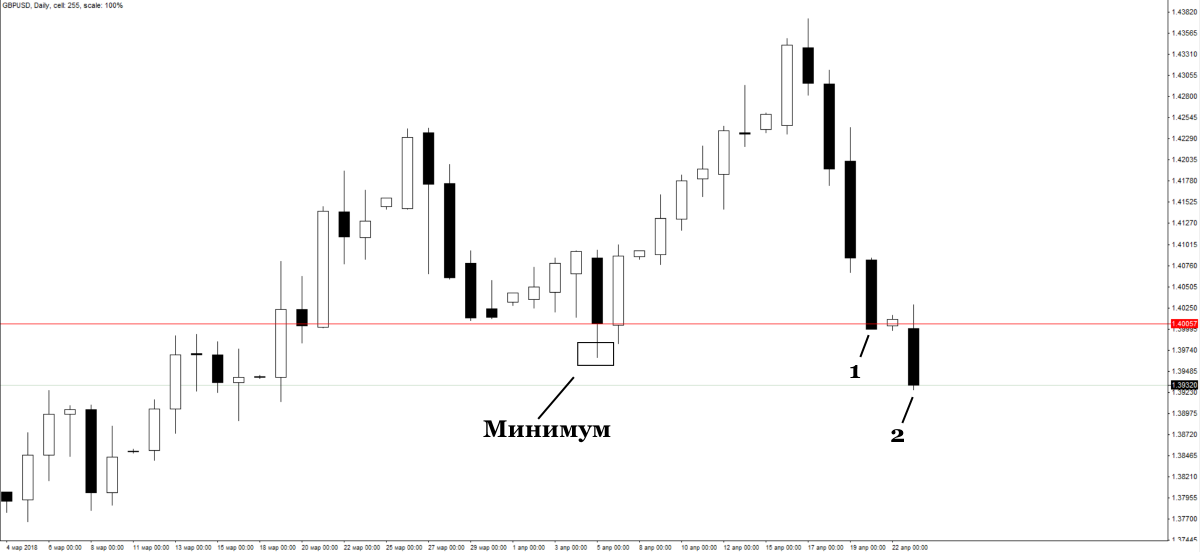
2) the Sample deal below, after a trend reversal, has the feature of tracking stop on the daily chart. In this case, switching to H4 TF occurs after the detection of a change of trend on D1.
So, the two bearish candle closed below the closing line of the last minimum.
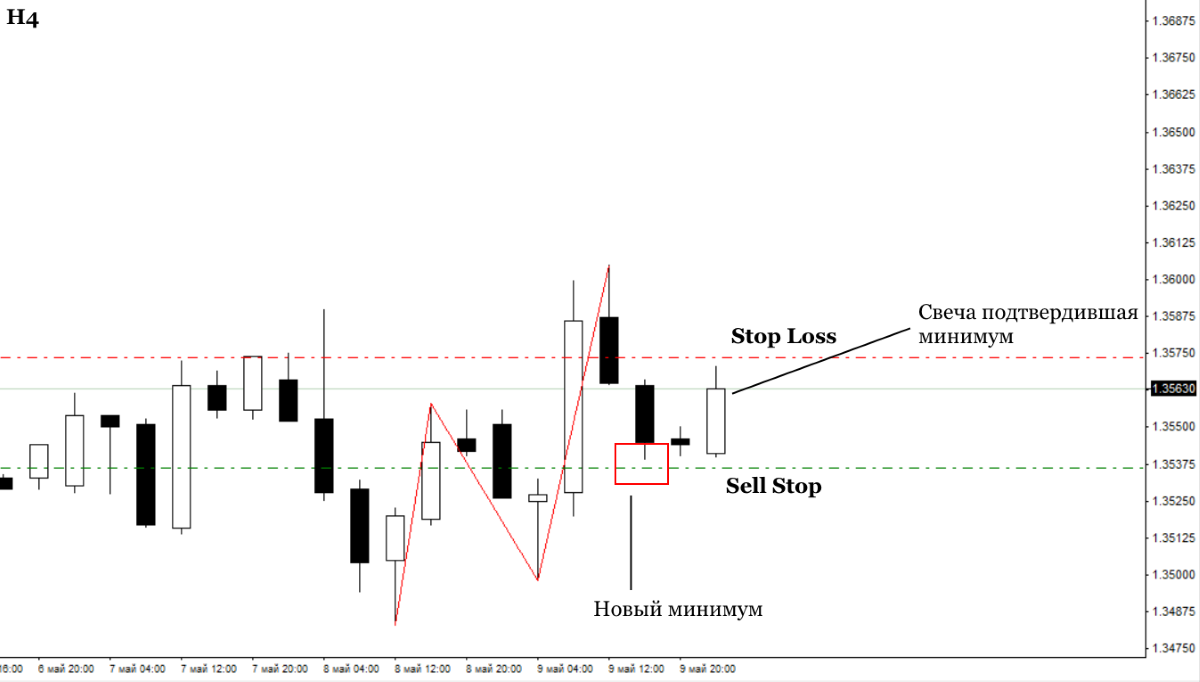
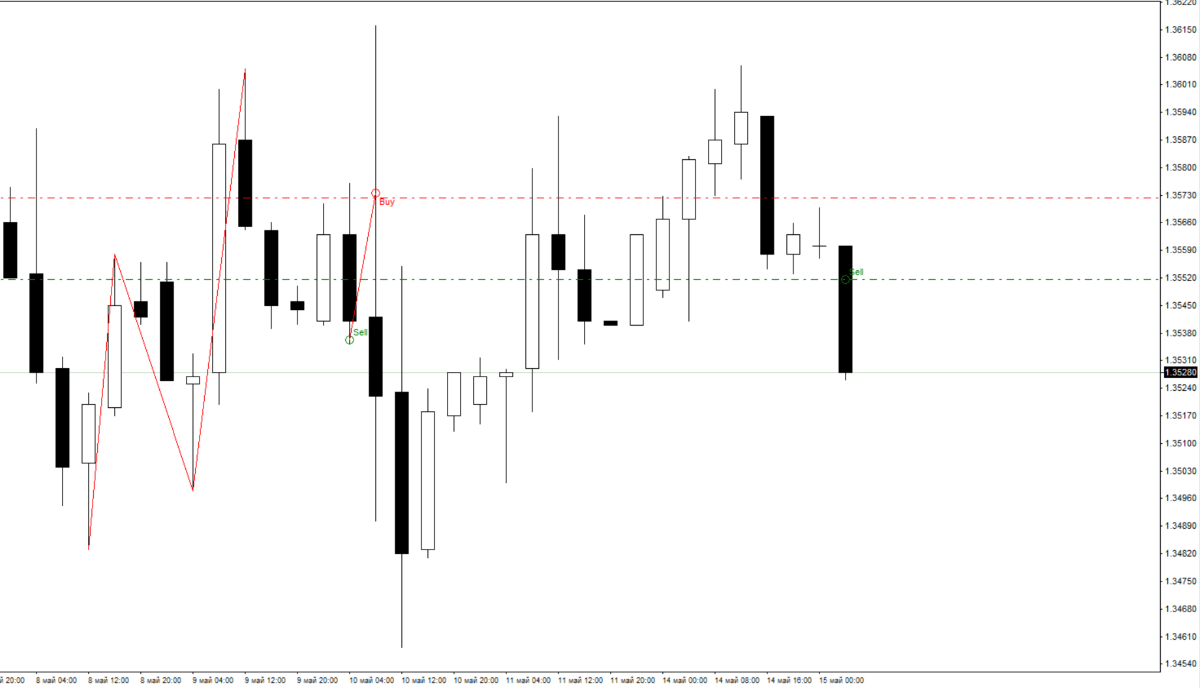
As was the breakdown of the uptrend on H4 looking for an entry point in the short that is waiting for the breakthrough of the local maximum , and then three waves of the bullish trend. After their education we put pending order Sell Stop below the new minimum. Stop-Loss — a candle, breaking through the high low.
 Our order is activated and soon it sputters at a stop , lost 37 points.
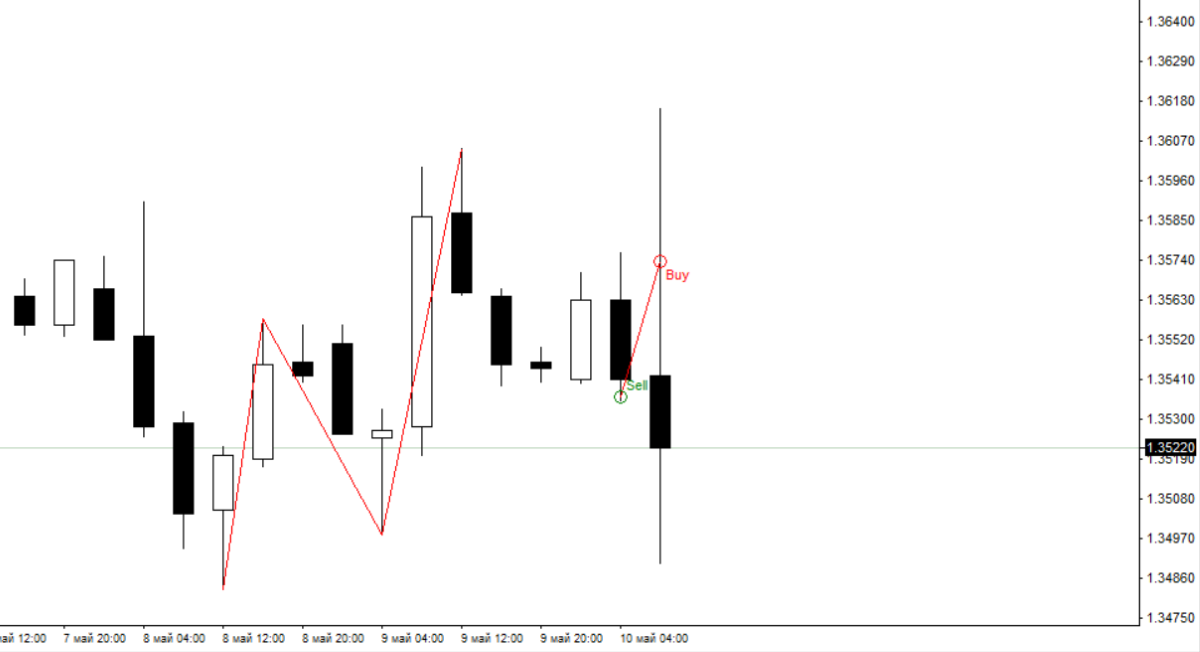 Waiting for a new low to enter again, soon it is possible.
 Further, since we had a trend change, we will move the stop loss behind each new high in D1.
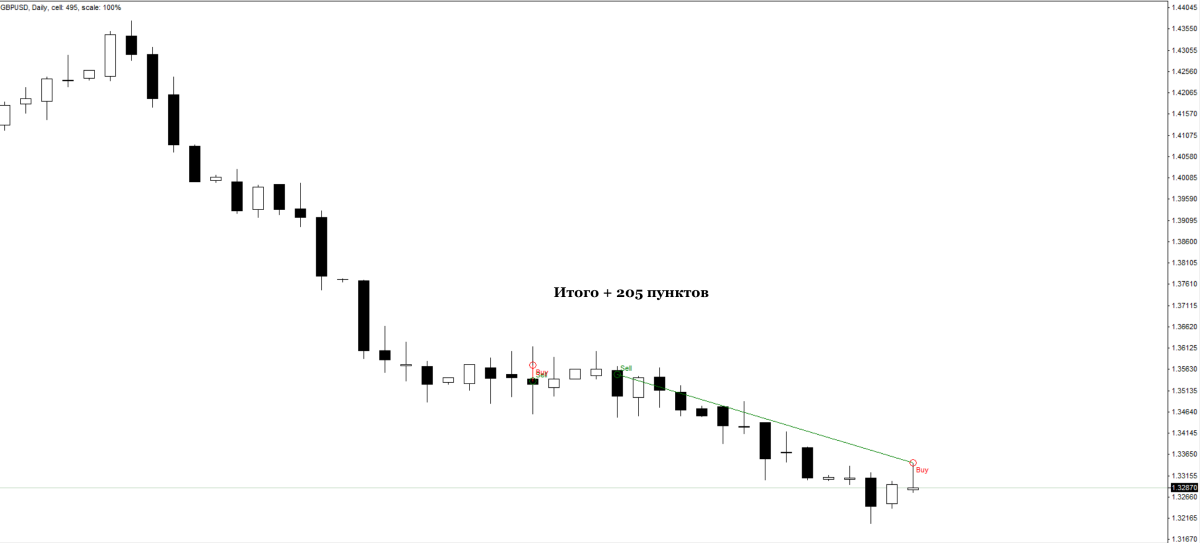 In the end the trade closed with a profit of 205 points.
Conclusion

Strategy unique simple and understandable approach to transactions. The rules interpret to identify the trend and entry algorithms, the trading system is devoid of the need to apply indicators, and the use of H4 timeframe gives the minimum loss for the vehicle based on the daily candles.
However, the examples show that even the norms for trading (the third wave, trade the trend, and so on) does not keep the trader from losses in flat, accidental dislodging stop for news and other standard traps of the Forex market.
Even if you strategy Inside Trend System and not attracted, we suggest to adopt rules for determining maxima and minima — will come in handy, believe me.
Maximize profit given tactics will help branch is the author of the strategy on the forum where fellow traders can answer your questions or give useful advice.