
Hello!
Not so long ago on our site you can get acquainted with a very famous trading system no less than the famous trader bill Williams Profitunity. To work under this system, the author has created several indicators, and one of them has a very intriguing title — a Wonderful Oscillator bill Williams (Awesome Oscillator, AO). And as you may have guessed, is exactly what we will examine today.

Characteristics of the indicator
Platform: Any
Currency pairs: any
Timeframe: any
Trading time: around the clock
Recommended brokers: Alpari, RoboForex, Amarkets

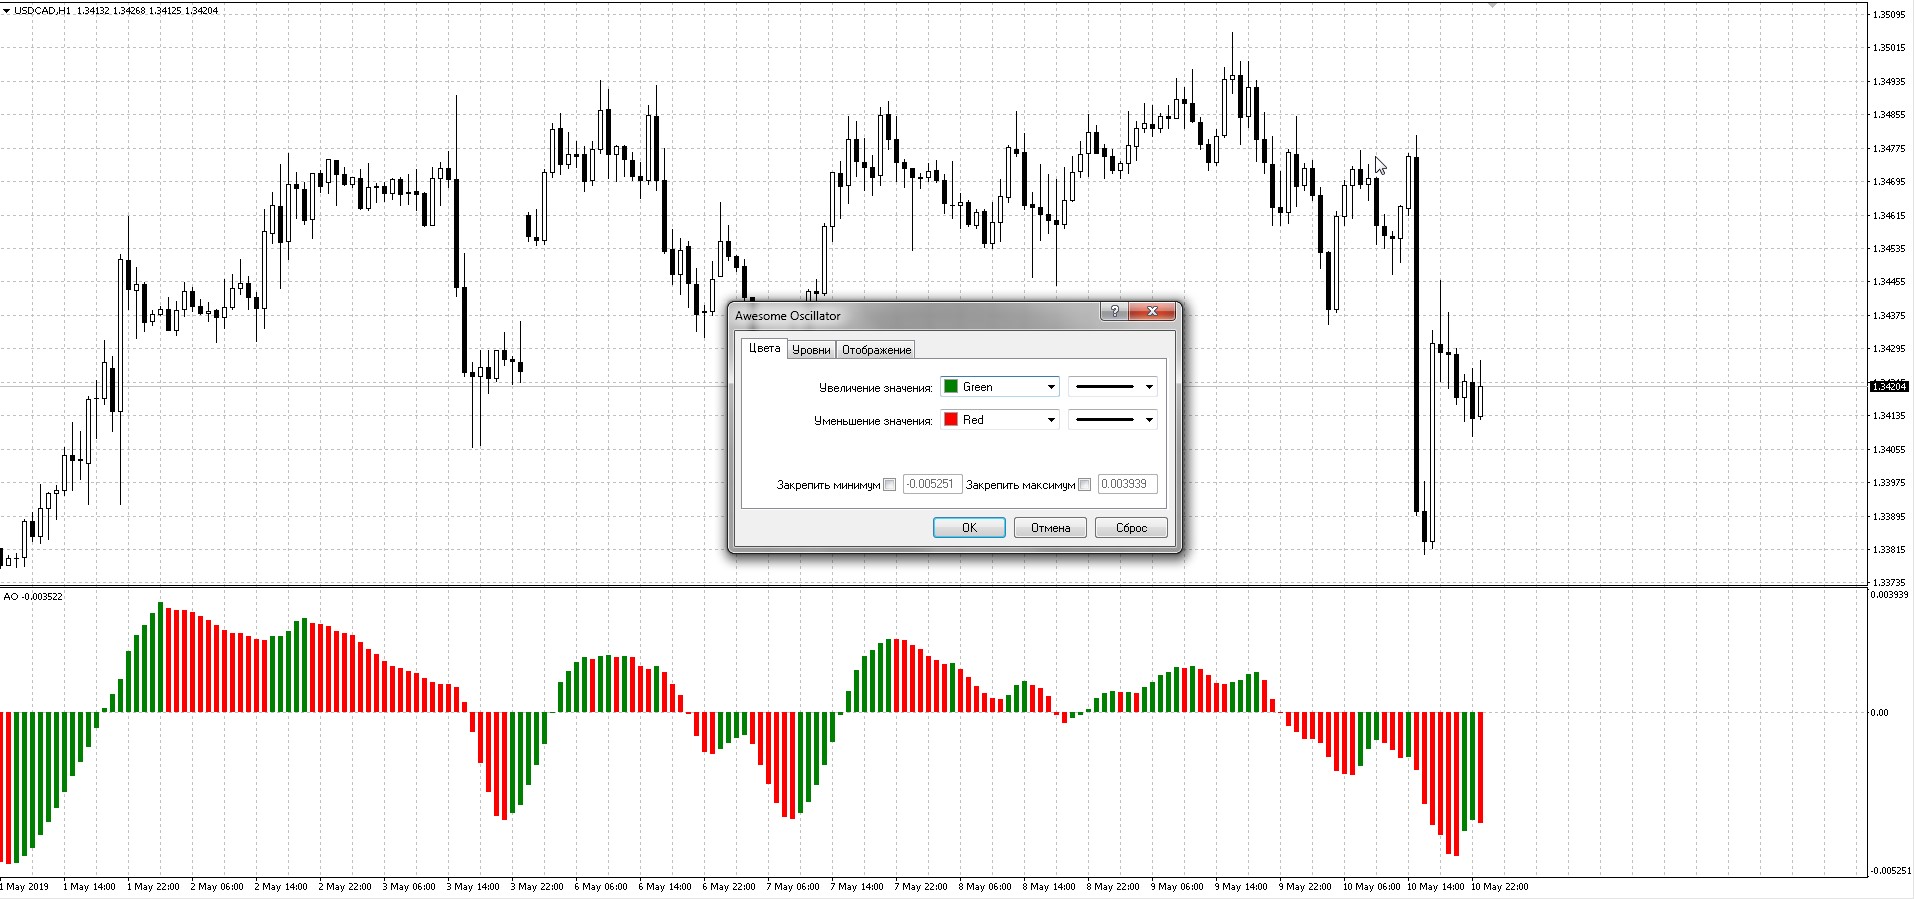
Despite the intriguing title, this oscillator is not very different from the well-known MACD. Principles of work with display in General the same. In fact, the indicator helps to determine the driving force of the market by subtracting the values of the slow moving average with the period 34, built at the median price, from the fast moving average with a period of 5. The histogram consists of columns of two colors — red and green. If the column is red, it is below the previous one, if the green is higher. Ranges the histogram of the AO oscillator around a zero line and has no overbought and oversold.
An AO is a standard set of terminal MT4 and does not have any settings except the color. To add it to the chart trading tool — open the menu “Insert/Indicators/bill Williams ‘indicators/Awesome Oscillator”.
 Periods of moving averages hard-coded in the code of the indicator. However, for experimentation you can download a set of custom indicators prepared by our undisputed king of indicators Pavel888 on the forum in this section. There are many variants of the indicator AO, including setting periods.

The indicator calculation

Median price (Median Price) is the quotient of the sum of the maximum prices and minimum prices for two. Sometimes to calculate also used Typical price (Typical Price), which is obtained by dividing the maximum, minimum price and closing price for the three.
The method of calculation of the AO indicator is very simple – it suffices to calculate the difference between the moving averages of median prices with periods of 34 and 5:
 As you can see, two moving averages have the same shape of the indicator. Thus, the formula is as follows:
AO = SMA (Median Price, 34) — SMA (Median Price, 5)
where:
SMA — simple moving average,
Median Price — median price.
The signals generated by the indicator Awesome Oscillator

Despite the fact that AO belongs to the category of oscillators, and developed as one of the filtering tools in the strategy Profitunity, this indicator also provides and independent signals.
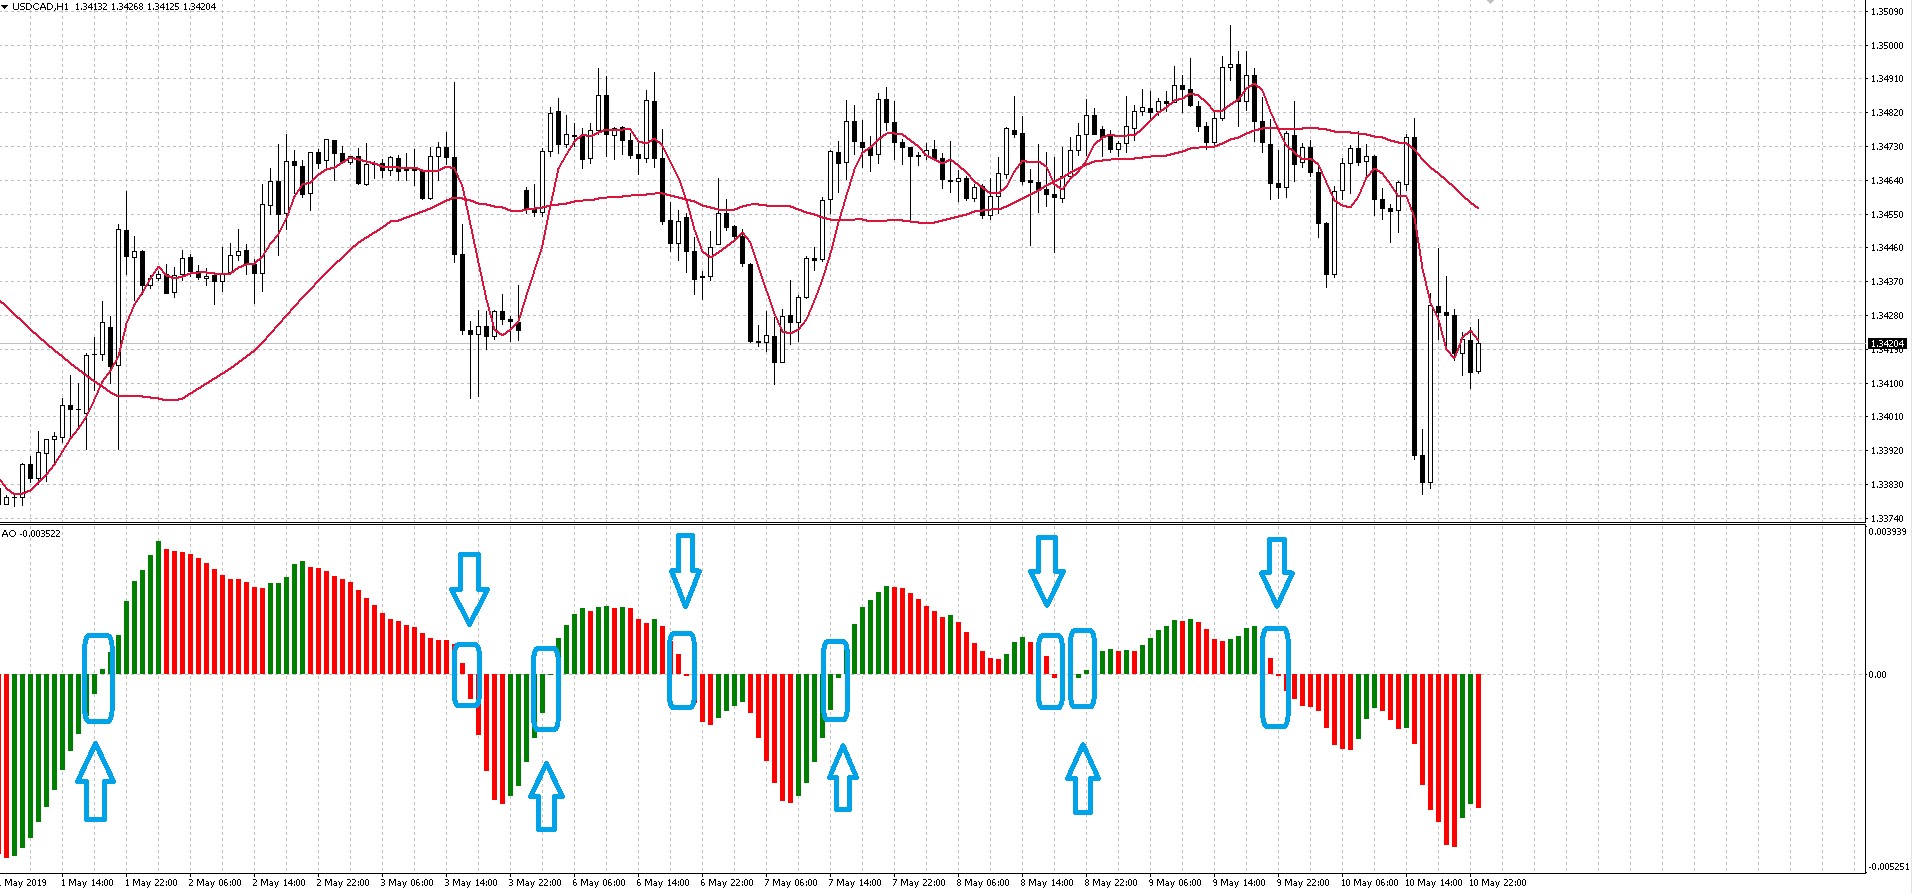
Crossing the zero line or the signal “Zero cross”
The easiest reference signal generated by the indicator is Awesome, is a Zero Line Cross. The signal to buy is generated when the histogram crosses the zero line upwards. The first column is below the zero line, and the second above the zero line. Selling signals the opposite.
 The Two pikes signal
The signal “Twin Peaks” (or “Two peaks”) for the purchase occurs if there is a second local minimum is higher than the previous, and these local minimums are below zero. For sale need to find the two falling peak. If there is a third local minimum or higher than the second maximum below the second for the sales, it is regarded as a signal amplifying:
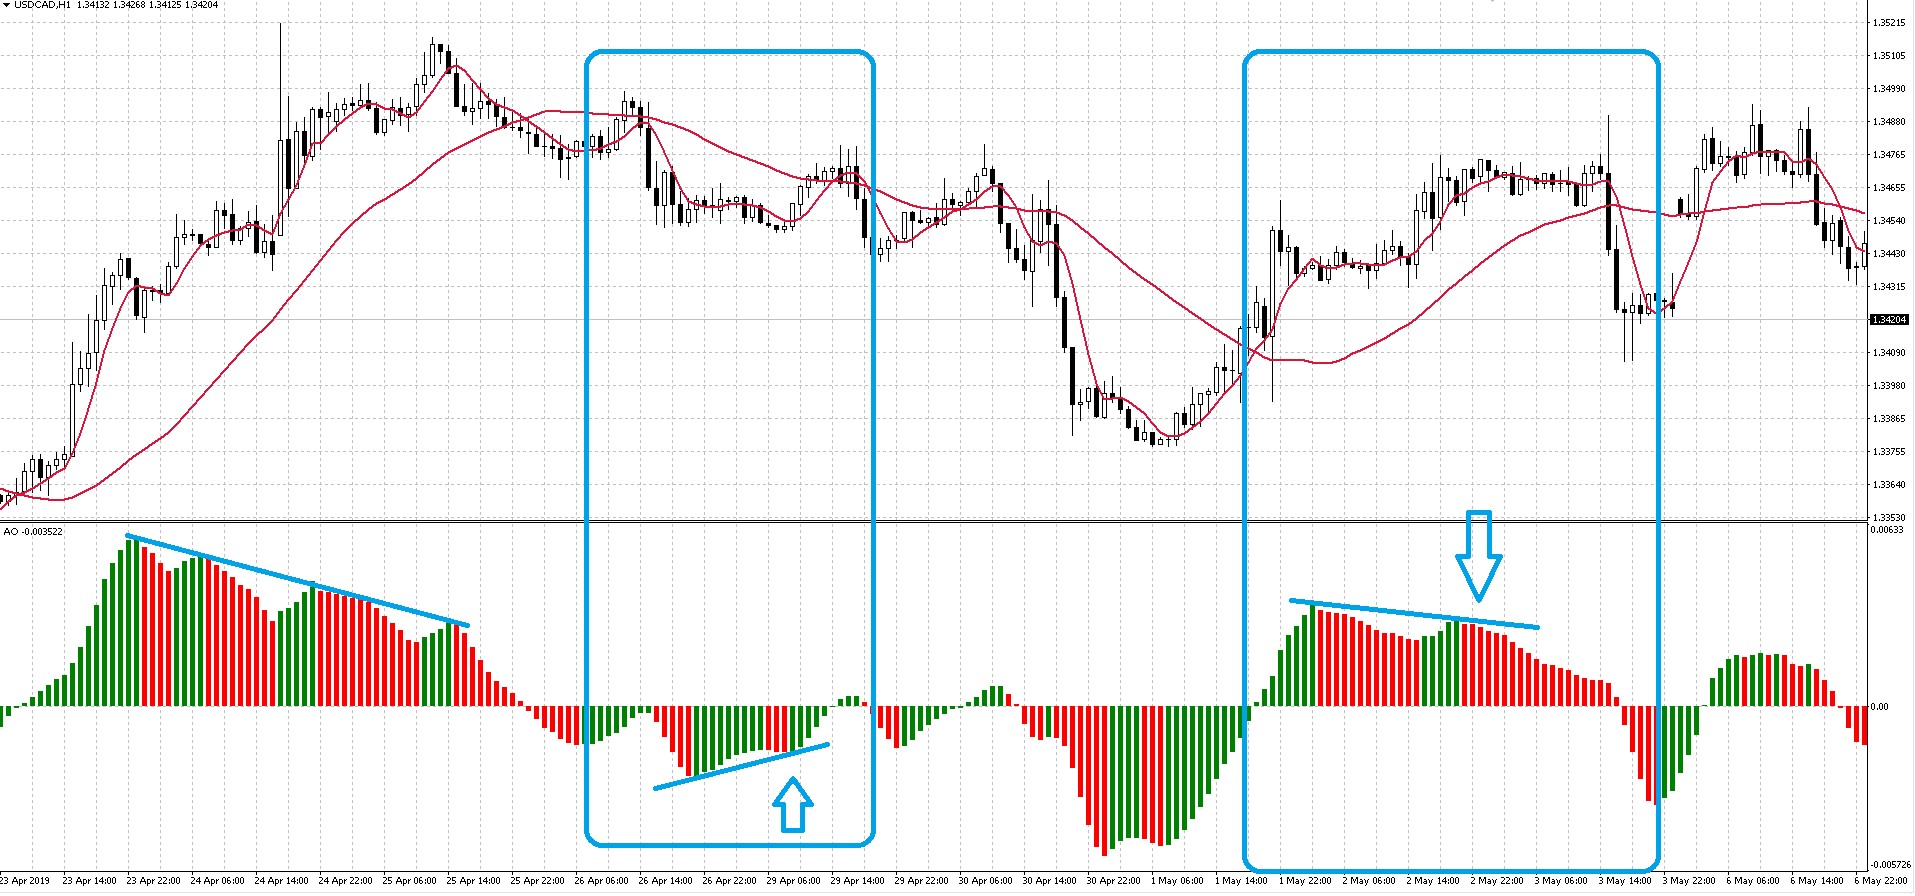 In fact it is a rather weak signal as it may be four consecutive lower high, as in the figure above.
Signal “Saucer”
Signal “Saucer” (or “Saucer”) for the purchase is formed when the Awesome Oscillator is above zero line and the histogram has reversed its direction from downward to upward, that is, of the three columns of the histogram have any first color, the second is red and below the first, the third above the second column and green. This signal is sometimes called a “Saucer”, and it looks as follows:
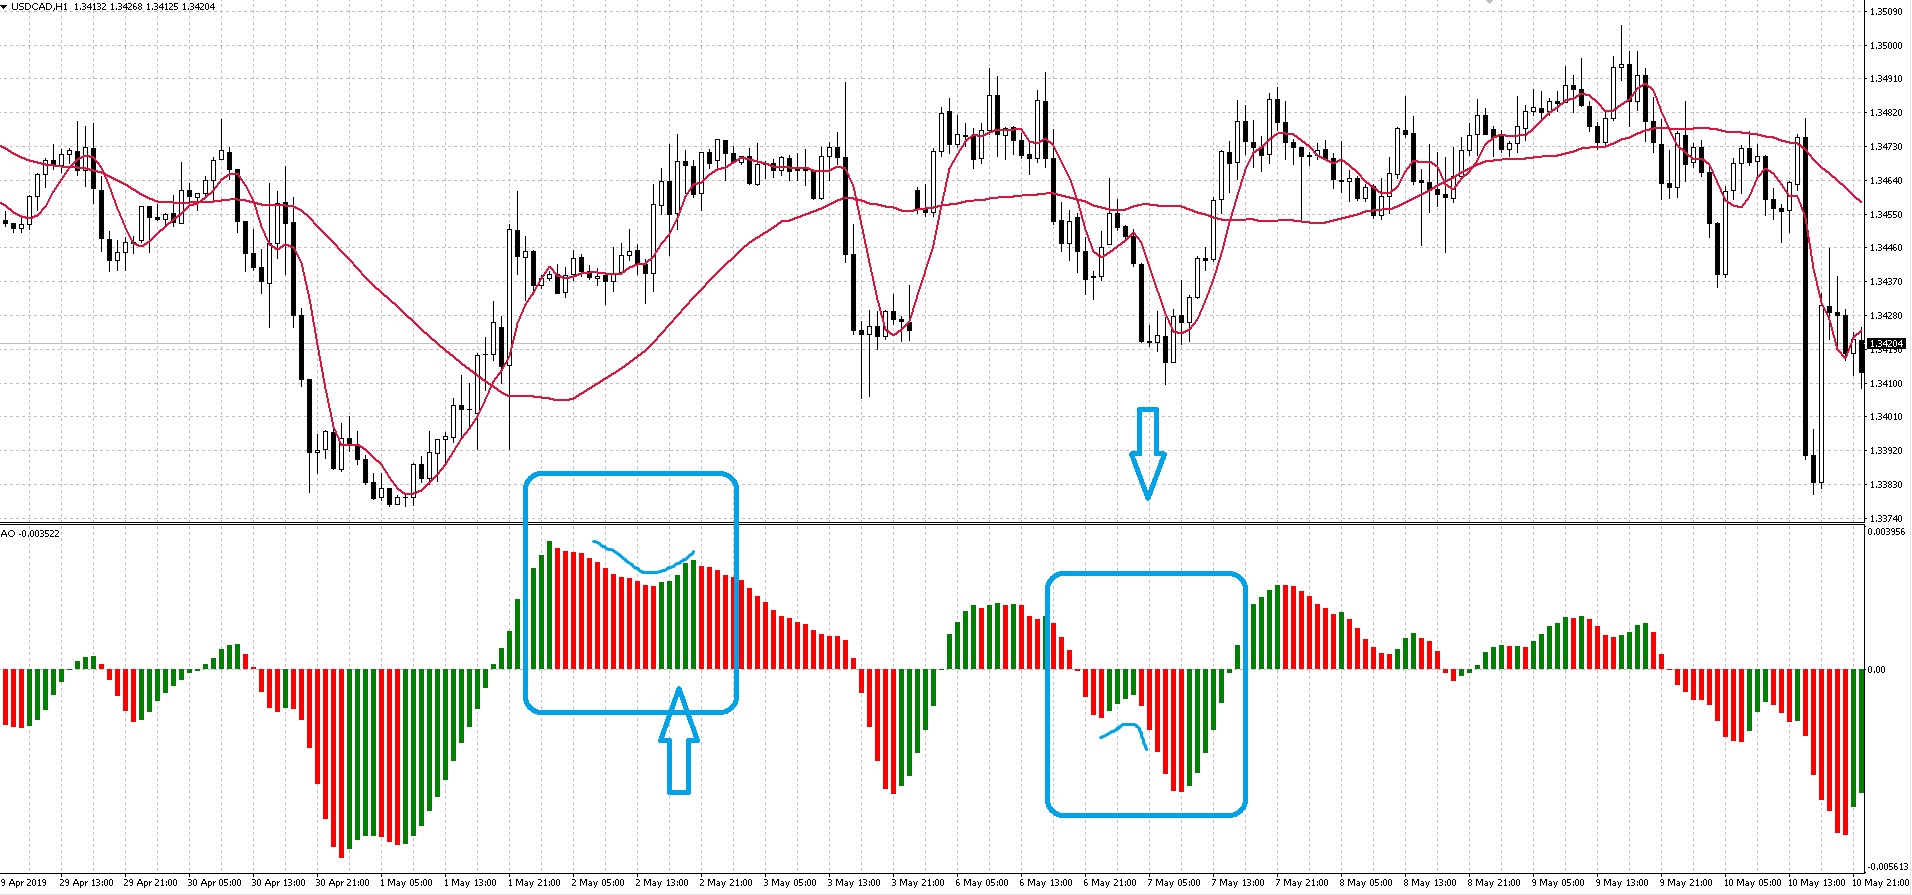 This is the only signal to buy that comes when the histogram is above the zero line. It is also a pretty weak signal, because after the first peak/trough movement may be too short-term in nature, and it is possible to earn not enough. It is best to take signals “saucer” when the first peak or trough is located near the zero line and the indicator has plenty of room to fall, as in the case of sales in the above picture.
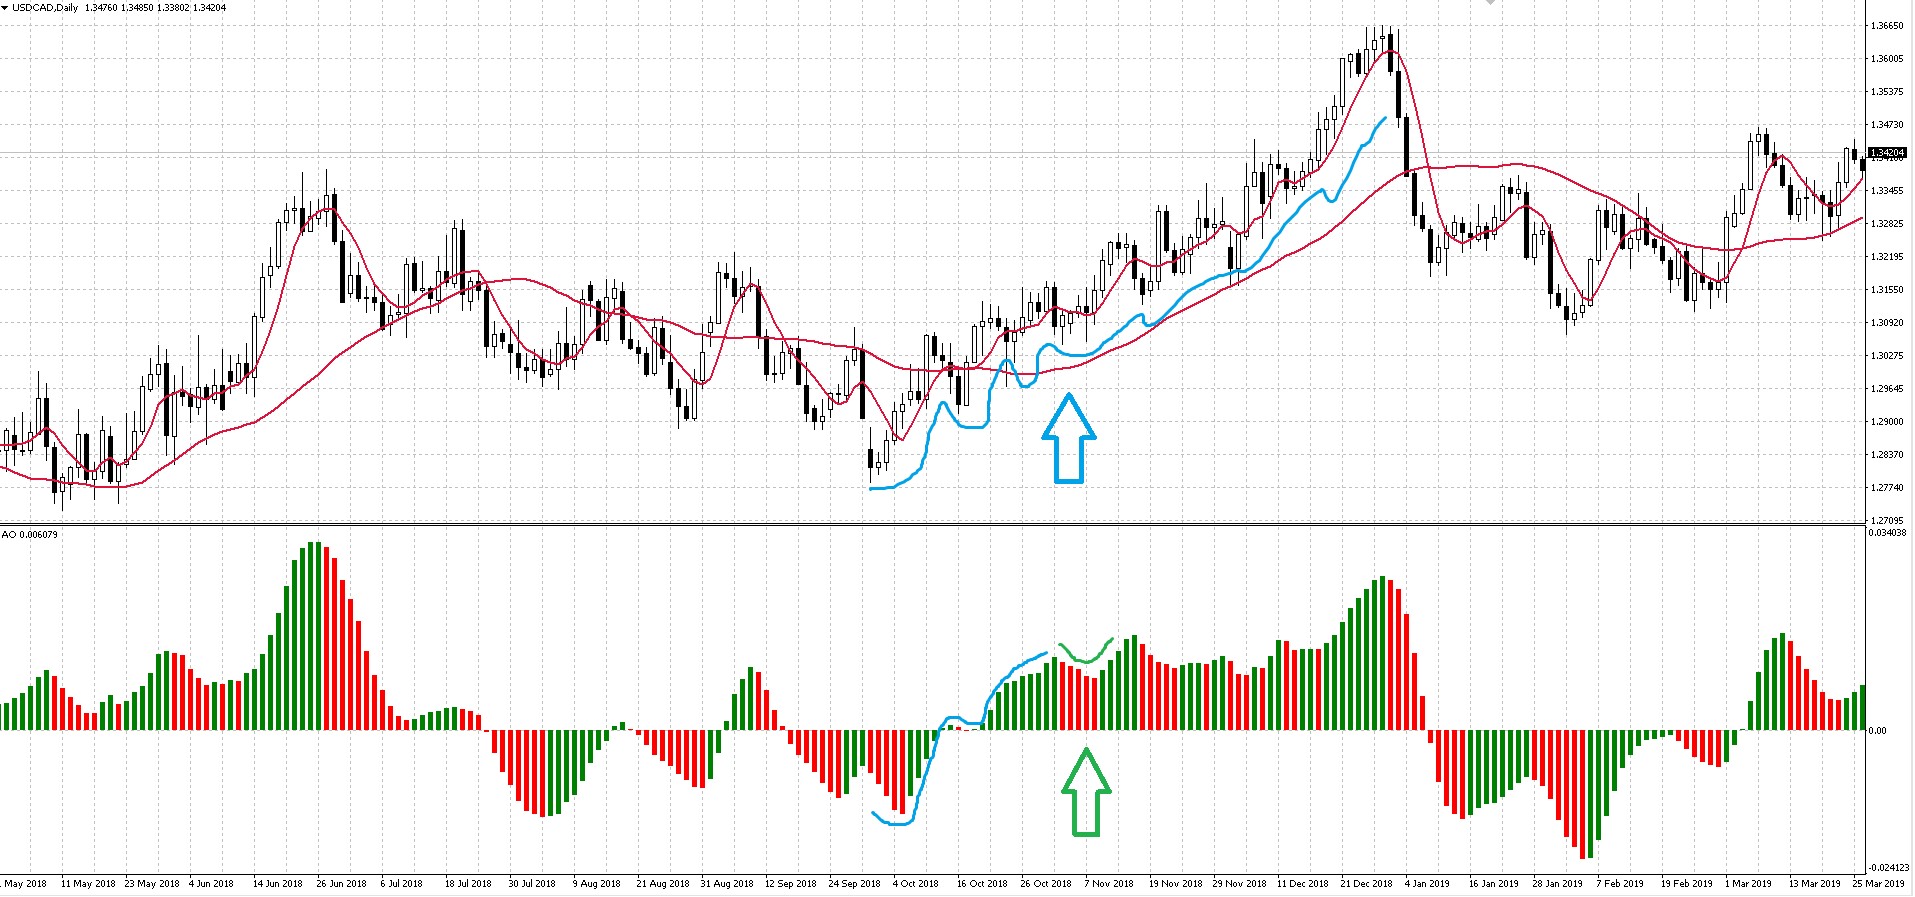
Remember that the origin of the signal “Saucer” for buying the histogram should be above zero line and the sales – below. In fact, this model describes the entrance to the continuation of the trend after a small pullback, so on the chart to enter on this signal you should see the uptrend, and the indicator ideally should consistently rise from the opposite zone. Here’s a good example for purchases:
 By the way, this version of the sell signal called “Inverted saucer”.
Conclusion

Awesome Oscillator – an interesting and efficient tool, able to give good entry signals. However, as with any other indicator and Awesome Oscillator should you use in the trading system in conjunction with other indicators. Remember — indicators that I am not mistaken, does not exist. Follow money management and do not uprate risks on transactions. Follow the rules of your trading system that have been properly tested on historical data.
The signals from the Awesome Oscillator is quite unambiguous and easy to interpret, so their use in their trading systems can be recommended to beginners. It should be remembered that the AO catches the short pulses, and should adjust the holding time according to the system based on it, to 5-10 candles, no more.