Hello fellow traders!
Two years ago, it was 50 years since Studies in Tape was published Reading, which laid the foundation for the theory of short-term scalping strategy and Volume spread analysis (VSA). The author of the book, Richard Wyckoff, revealed in detail the relationship between volumes and prices, describing its principles, first in a series of articles in two of his own magazines, and later by publishing 9 books on this topic.
In today's material for you – an interesting overview of the trading route Wyckoff, as well as his strategy, which may be interesting and useful for Forex traders.

The recognized stock market analyst spent 15 years penetrating the secrets of Wall Street and began publishing his own knowledge at the age of 30, passing away at 60. The mark left by Wyckoff in the theory of market analysis turned out to be so deep that he received a separate direction after his death author, called Volume spread analysis.
The VSA strategy is actively developing in the 21st century, acquiring new principles and indicators, some of which are described in many parallel topics on our website.
This article will not become an anthology of the latest modern interpretations of the relationship between volumes and prices – its task is to acquaint the reader with the classical Wyckoff theory and remind traders of the author's contribution to modern stock trading.
First after the Dow

Regardless of our level of knowledge and involvement in the market, many of us have heard of Charles Dow's theory , which became the basis of the first laws describing the movement of quotes of any assets. The discoverer of the principle of index display of stock prices formulated the following postulates at the end of the 19th century:
- Trend types;
- Phases of market conditions;
- Asset correlations;
- Interrelation of volumes and prices.
The last postulate turned out to be the key one, having the same importance for trading as a lever and a fulcrum for physics, discovered by Archimedes.

The Dow theory has remained a theory – a simple description of the facts observed on the chart and does not give any special advantages to the trader, only indirect conclusions for trading strategies:
- Trending systems are more likely to make a profit than countertrend trades;
- Industry and stock indexes can act as trend indicators for individual stocks, currencies, and commodities due to correlation.
Richard Wyckoff gave traders a set of rules and tools that almost unmistakably determine using volumes and certain types of charts all the postulates of Charles Dow listed above.
During the presentation of the material, the part of the knowledge of the VSA strategy regarding tape reading and order book will not be affected.
Wyckoff has spent more than half of his life researching intraday scalping. In the decentralized Forex market, there is no full-fledged order book and intraday trading volumes covering the market as a whole.
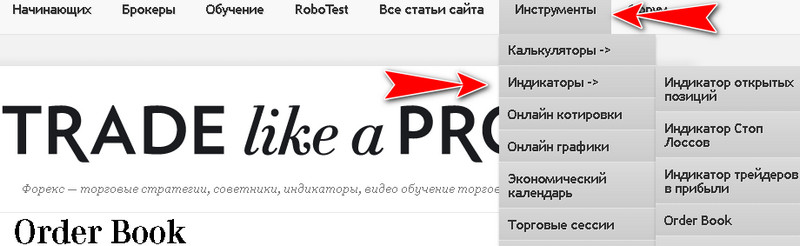
This problem is described in more detail in the “Order Book” service, where the positions of Oanda broker clients are collected. There you can also find a brief description of the rules for making transactions and analyzing positions in the order book. The service is opened from the menu on the main page of the site “Tools”, the option “Indicators”.
What you need to know about Richard Wyckoff?
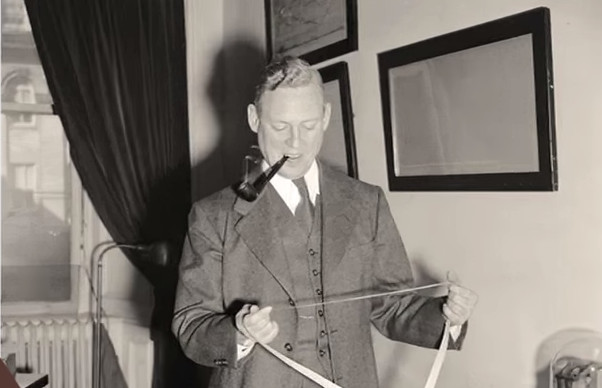
A fascinating article about the life of Richard Wyckoff has been published on our forum, revealing the founder of the VSA from an unexpected side, which is little covered in the Russian-speaking segment of the Internet. Information about the first theorist who described the relationship between price and volume is often mythologized or misses important traits of his character.
Richard Wyckoff died a wealthy man, but a significant part of his income was brought not by the market, but by the release of a magazine. The first edition was The Ticker, which revealed in detail all the knowledge gained and gained by a trader over 15 years of trading in securities.
From the age of 17, Wyckoff was involved in stock trading, having made a career that began as a clerk for a broker, working as a broker, market maker, and financial correspondent. Deciding to share his accumulated knowledge, he was forced to become an independent trader in order to pay for issues of The Ticker, which did not pay for itself.
The author set the goal of universal education – to give knowledge to small traders so that they would stop draining deposits to large players. Wyckoff was always struck by the huge percentage of small and medium sized speculators who lose money, he believed that the reason for this was the lack of publications on the theory of trading.
The articles made the publisher and trader famous, the books written on them are reprinted to this day, but the magazine with a subscription cost of $ 3 brought financial losses. Tired of writing and trading at the same time, Wyckoff is releasing a new 1-sheet edition containing only charts and entry marks.
Bulletin with signals of transactions “The Trend Letter” in the first year solved financial problems, and in the second year, due to a threefold increase in the cost of a subscription, made the publisher a wealthy man. The only thing that really upset Wyckoff was the unwillingness of many traders to undergo training, they had enough signals.
Many of the newcomers calmly gave funds to people who called on behalf of the broker, only because the voice on the phone gave a guarantee of payback and earnings on their investment advice. The stock market of the early 20th century was the Wild West. It was inundated with fraudulent brokers who quietly gained access to large exchanges. Market makers manipulated the stock price, there was a total lack of market oversight by Regulators.
Richard Wyckoff devoted the last 20 years of his short life to protecting the rights of small traders. Taking advantage of the fact that his third magazine, The Magazine Of Wall Street, became the most popular American financial publication, Wyckoff exposed “kitchens” (yes, they were already at the beginning of the 20th century) from its pages and forced large exchanges to revoke the licenses of unscrupulous brokers.
The publisher's “crusade” was supported by almost all significant traders of that time, under whose pressure the Securities Commission began a campaign in the US Congress to change the law. At the time of Wyckoff's death, there were no fraudulent brokers left on the American stock exchanges.
Basic Elements of Wyckoff Theory

As noted above, the theory of Richard Wyckoff is valuable in that it reveals the technologies for applying the postulates of Charles Dow. The founder of the VSA never took into account fundamental analysis, believing that the reaction of price and volume before the release of news or macroeconomic indices is the best indicator.
For the same reason, Wyckoff rejected any graphical elements of technical analysis, especially various patterns, with the exception of :
- Support/resistance lines;
- Pivot points;
- Trend definitions;
- Market cycles.
Determining market levels and pivot points

Support and resistance levels were determined by Wyckoff without reference to time. At the beginning of the 20th century, traders did not pay attention to timeframes, working with a telegraph tape that transmitted the price flow.
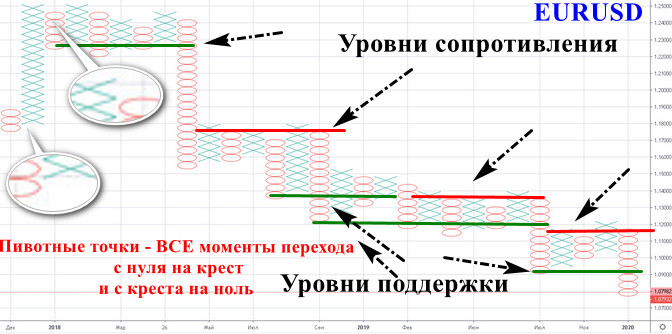
Wyckoff's friend, Jesse Livermore, gave a complete picture of the process of describing and accounting for the price, his memoirs are set out in an audiobook on our website. Traders marked only the price – an increase with a cross, a fall with a zero, the figures replaced each other after a given parameter of a decrease or increase. Wyckoff used for reversals:
- Cross if the rate has risen three points above the last low;
- Zero if the rate has fallen from the last high of the price in the tape three points below.
The Tic-Tac-Toe chart is automatically built in the TradingView service. The example below shows how easy and efficient it is to build levels on it. Determining the pivots will also not cause difficulties – these are the zones of changing crosses and zeros.
Identification of market trends and cycles
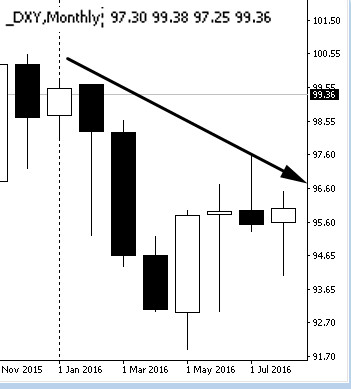
VSA theory was created for the stock market. Richard Wyckoff opened medium-term positions in stocks only on the trend, which was determined by the stock index. The direction of the market movement was determined on the MN (month) timeframe.
There is only one DXY/USDX index known in the foreign exchange market. When adapting the rules for opening Wyckoff positions for Forex, you should adhere to the following tactics:
- Trades are opened only according to the trend, which is determined from the new year, starting from the first quarter (the first New Year months are considered relative to the fourth quarter);
- We pay special attention to the breakdown of annual highs and lows to look for short-term countertrend trades.
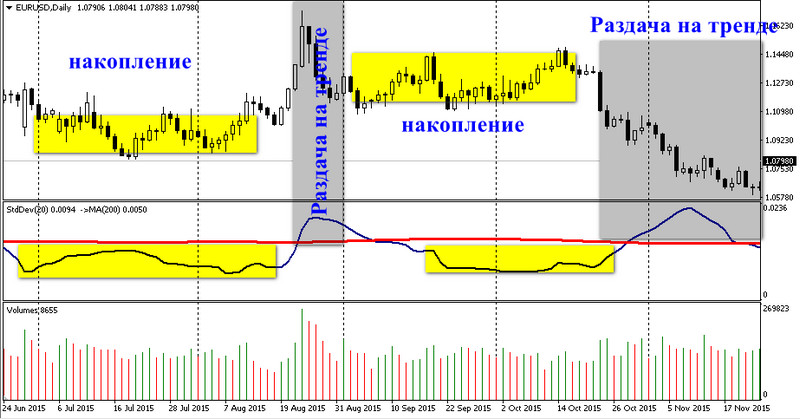
Market cycles are determined by comparing volatility and the current trend on a daily chart. According to Charles Dow's theory, Wyckoff distinguished two main cyclical phases of the state of the market:
- Accumulation of positions in a flat;
- Asset distribution along the trend development.
Early in his career, working in brokerage houses and in the pit of the stock market, Richard Wyckoff observed that the big players contained market fluctuations by gaining position. At these moments, assets reacted weakly to fundamental indicators and economic news.
The situation changed only after the end of the formation of the position. Quotes soared or fell for any insignificant reason. Large players now needed a trend to distribute the accumulated asset and take profits.
Strong movements were provoked by hired market makers in order to involve as many traders as possible, able to absorb the volume of positions of large players distributed with profit on FOMO-phobia.
Low volatility determines the position accumulation cycle. High – distribution and the moment of the end of the trend. It is determined using the standard deviation indicator located in the footer of the chart. An MA line with a period of 200 days applied to the Standard Deviation values helps to delimit the cycles.
Richard Wyckoff's Countertrend Ops Rule

Countertrend trades must be entered into by the trader at the end of the distribution phase in the direction of the global trend of the DXY/USDX rate. In this case, the following prerequisites must be met:
- Intraday volumes must be twice the minimum value recorded in the accumulation phase;
- The body of the entry candle must be twice the average daily range ;
- Volatility should be above average.
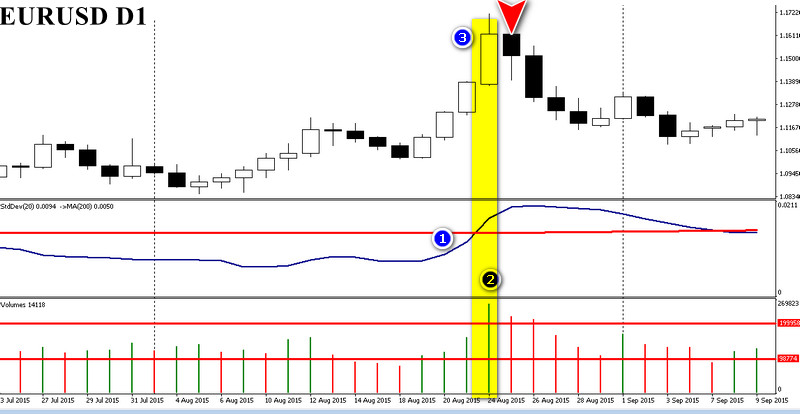
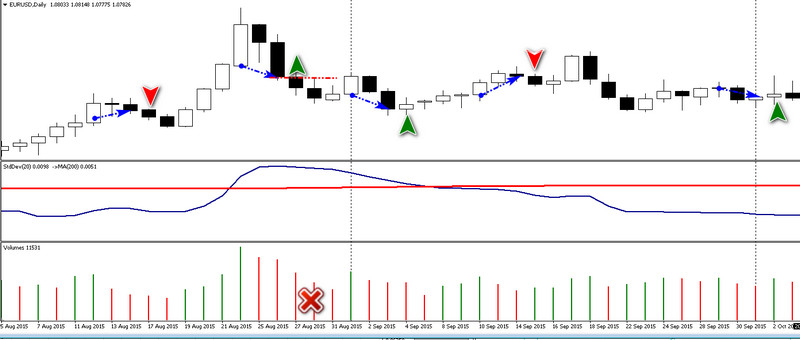
At the accumulation stage (volatility below the moving average with a period of 200), the trader determines the smallest volume value, in the figure below it is marked with a marker. Once the minimum intraday volume is determined, multiply the value by two and draw the level higher. This is one of the trade signal lines.
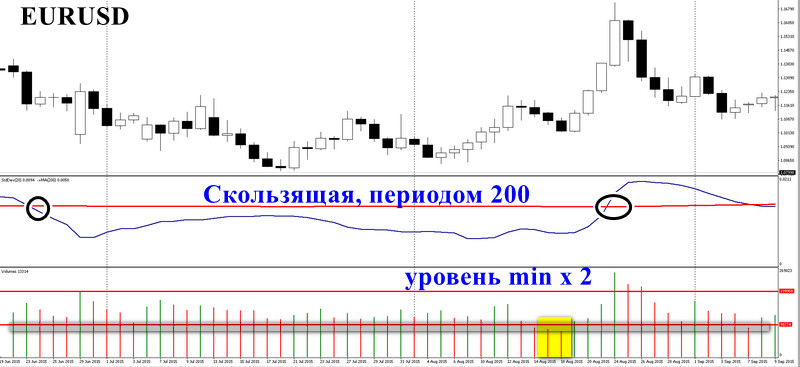
The next step will be to determine the trend where a major player will move the market. You can correctly determine the direction by connecting the points of the beginning of the accumulation zone with a candle corresponding to the reverse intersection of Standard Deviation with a moving average with a period of 200.
>
After determining the trend on the daily chart, we look at the global trend on DXY – from the beginning of the year to August 2016, considered on the chart, it is downwards, which coincides with the future Short countertrend trade.
A Short trade is entered as soon as three signals match:
- Intraday volume rises above two times the accumulation phase lows;
- Volatility crosses the 200 moving average from below;
- Candle coincides with volume twice the medium-term range.
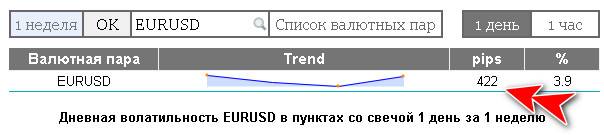
Our site has a special service for determining the average volatility of each pair, from which it can be seen that daily candles are traded in a range of 42 points. The entry candle showed over 200 points. The higher the intraday volume and the corresponding candle range, the higher the probability of a profitable countertrend trade.
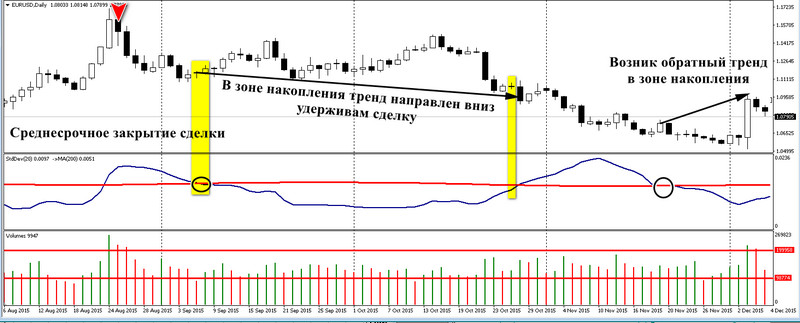
The trade can be held until the chart moves into the accumulation zone with a medium-term strategy, and in the long-term option, it can be held until the reverse trend detected in the low volatility interval is confirmed.
Trades are covered by stops just above the nearest support and resistance lines. In this example, this is the resistance of 1.1350, taken from the Tic-Tac-Toe chart. If the position is held long-term, then the stop loss is moved to the breakeven zone as soon as the currency pair enters accumulation mode.
p>Short-term counter-trend trades with a duration of no more than two daily candles give divergences in trends and volumes. Richard Wyckoff noted the “springboard” pattern, which is three consecutive drops in intraday turnover after a local peak.
Having determined the trend on three daily candles corresponding to the volumes, the trader can make trades in the opposite direction. The basic rules for such countertrend trades are:
- Only the first two drops after the histogram are taken into account;
- The trend is defined as a line connecting the opening price of the first and the closing price of the third candle.
The position is closed with a profit on the first candle, and with a loss, one more day is held to close the trade to zero. After a two-day interval, the position is closed with a negative result, without waiting for the stop loss to be triggered. It is considered equal to double the average volatility, it can be determined in the service on our website.
Richard Wyckoff advised using “springboard” tactics in accumulation zones; at the distribution stage, it is advisable to wait for a jump in volume and price in order to enter a medium-term position.
Trading with the trend

A trend in the classical definition of market theory is a successive alternation of extremes (highs and lows). An upward direction indicates an increase, and a downward direction indicates a decrease, but only if the movement is confirmed by volume.
On an uptrend, Richard Wyckoff suggested comparing the volumes on the three candlesticks of the new high with the previous high. The trend was considered confirmed if the current indicator was higher – then the trader received an entry signal after a rollback, if the volumes of the lows were lower than the previous values of a similar extremum.

Anomalously high volumes are excluded from the trend verification technique: they signal a possible trend reversal and are suitable for the countertrend medium-term trades described above.
If a downtrend is detected, high volumes should confirm new price lows, and highs should correspond to trading volume less than the previous extreme value.
False breakouts

Trends don't always end with abnormal volume and a candle with a large daily trading range. The directional movement fades due to the lack of “fuel”, the volumes of buyers and sellers fall to a minimum. Richard Wyckoff noted that this phenomenon occurs near strong support/resistance lines, giving the trader an accurate signal of a false breakout.
The picture below shows how the retest of the 1.1200 level by the EURUSD pair took place on low volumes, which gives the trader the opportunity to understand that there will be a rebound.

The rebound did not become the beginning of a local growing trend, the volume of the previous high exceeded the volume of trading at the new extreme. Exactly the same situation arose with the lows, indicating another false breakout of support. Wyckoff believed that this situation is normal for the accumulation phase – large players often gain a position during a flat period, holding the course and “killing” local trends.

This breakout was confirmed by anomalous volume, before which a comparison of the daily turnover of candles corresponding to the highs of the local growing trend, as in the first case, showed a false rebound.

At the same time, the volumes did not exceed the double value calculated from the minimum intraday turnover registered in the accumulation zone. Richard Wyckoff believed that a breakout confirmation was the perfect time to enter on the next candle. The previous candle's open price acted as the stop loss level.
Conclusion

The VSA theory was created 30 years after the death of Richard Wyckoff; a series of articles and books became the basis for a fairly capacious number of techniques and methods for analyzing the market through the relationship of price changes with trading volume.
Wyckoff traded easier, without modern capabilities for automatic charting, visualization of order volumes, the use of indicators, how modern trading terminals do it. This did not prevent the trader from becoming a recognized master of forecasts, who was forced to refuse to publish trading signals due to the strong insider influence on the stock market.
The approaches of the founder of VSA disclosed in the article are quite simple, effective and understandable even for a beginner. The modern interpretation complicates or distorts the author's ideas, which are worth getting to know better by studying the original books published by him and a selection of author's articles from his own journal.
Article &# 8212; Richard DeMille Wyckoff (Part 1-3)
Article — Richard DeMille Wyckoff (Part 4-5)