
Hello, fellow Forex traders!
Today we’ll meet an unusual and original strategy, developed more than half a century ago, the famous trader Joe Ross. As you probably already guessed, this article will focus on the Ross hooks.
Frankly, this pozabite vehicle for many traders and not so often used by them. However, trading on it, you can make a profit on the financial markets. How to do it in the twenty-first century – now tell.


In the professional environment of Forex trading there are two approaches to forecasting exchange currency pairs: the analysis of the price stream using the technical indicators or using Price Action (PA).
PA is a forecast of trends in price movements, the method is popular because of the lack of lag and more informative information about the future movement. Patterns and graphical analysis provide an opportunity to determine in advance the zone of take profit, pivot points or correction.
If the indicators operate according to some hidden formula for a complex calculation signal, receiving the data from past historical periods, figures candlestick analysis formed “here and now”, rarely using the “deep dive”.
The popularity of Price Action has generated a lot of strategies that littered the Internet, but one of them is undeservedly forgotten. This hook Joe Ross – the author’s strategy, developed over 60 years ago.

Most interesting is that the author still teaches the art of trading learning portal Tradingeducators and nobody remembers what he looked like in his youth. Joe Ross came to the stock exchange in 1957, the strategy of trading hooks was one of the first that brought him real profit in 1959.
It was tested and perfected over 20 years, revealing its potential with the advent of the futures market in 1982. Later Joe Ross has dedicated this strategy a separate book – “Trading The Ross Hook”.
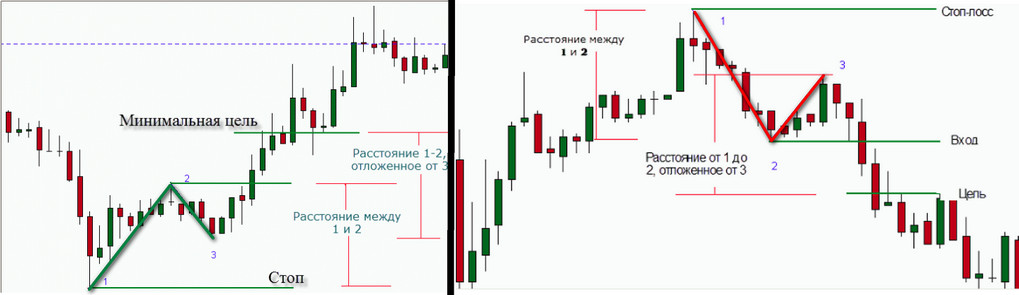
Pattern 1-2-3 is a basis of strategy Joe Ross

Pattern 1-2-3 was the first figure of the Price action, which is noticed a young student of Joe Ross in 1957. He had already started trading on it, repeating just exactly the trading strategy described in the article on our website.
Continuing education, Ross captured many trading systems, but a novice trader has continued to improve his own discovery. He quickly realized that discovered a pattern of hooks only works in:
- Reversal of old and the beginning of a new sustainable trend;
- Of liquidity and increased volatility tool.
Choosing the liquid asset, the trader can scale out strategy of the hooks on any timeframe. For example, some of his disciples, according to Joe Ross (he calls them “hukeri”, hook – a hook), hooks are trading on the updates.
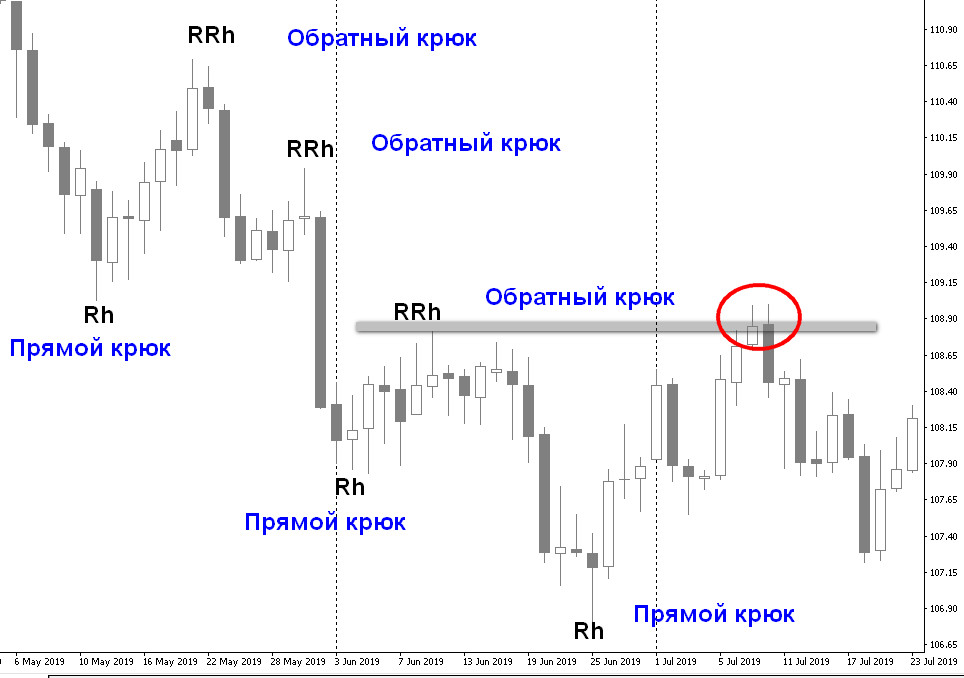
It is the search for and confirmation of the trend forced the trader to “go ahead” of price movement within the figures 1-2-3. A hook, designated by the author of letters on the chart, Rh (Ross Hook), allowed to confirm the pattern, and the breakout of it – the presence and power of the trend.
Another advantage of the hook, open Joe Ross, was his repetition: pattern 1-2-3 often create stable and long lasting new trend. Each peak or trough has become another hook that Ross used to login, by typing “pyramid”order.
To determine the end directed motion, Joe Ross used the reverse hook RRh, leaning on the opposite Rh minimum or maximum graphics. Breakthrough of the nearest RRh was the signal for the closing of all positions and new formations 1-2-3 in the opposite direction.
Characteristics of the strategy “Ross Hooks”
Platform: any
Currency pairs: any
Timeframe: M5 — D1
Trading time: intraday, on the time frames below H1 – only European and American session
Recommended brokers: Alpari, RoboForex, TickMill
Rules strategy

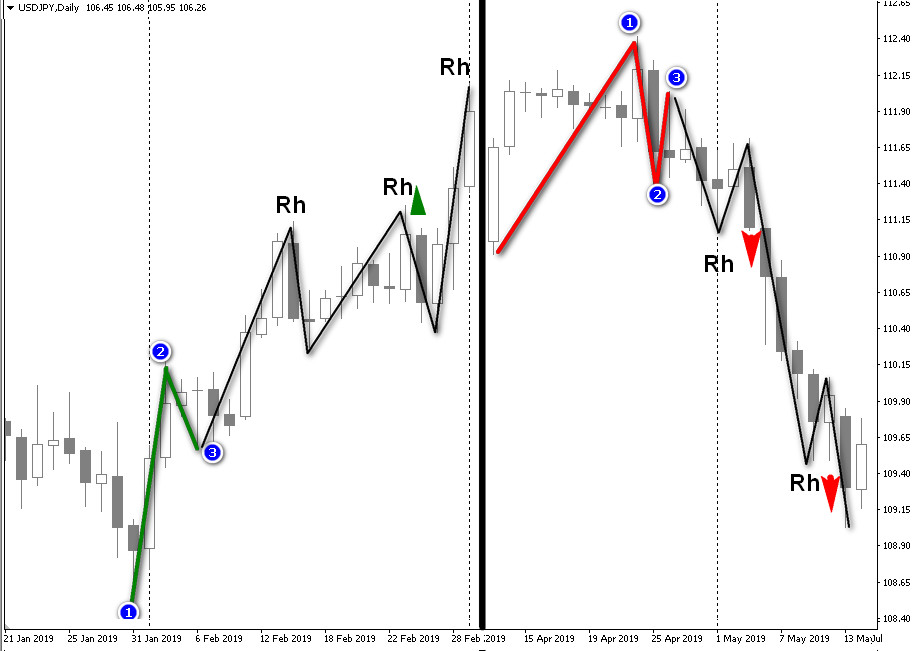
The basic rule of strategy 1-2-3 pattern formation, which was preceded by an obvious trend. As such is considered to be a downward or an upward formation with three hooks Joe Ross.
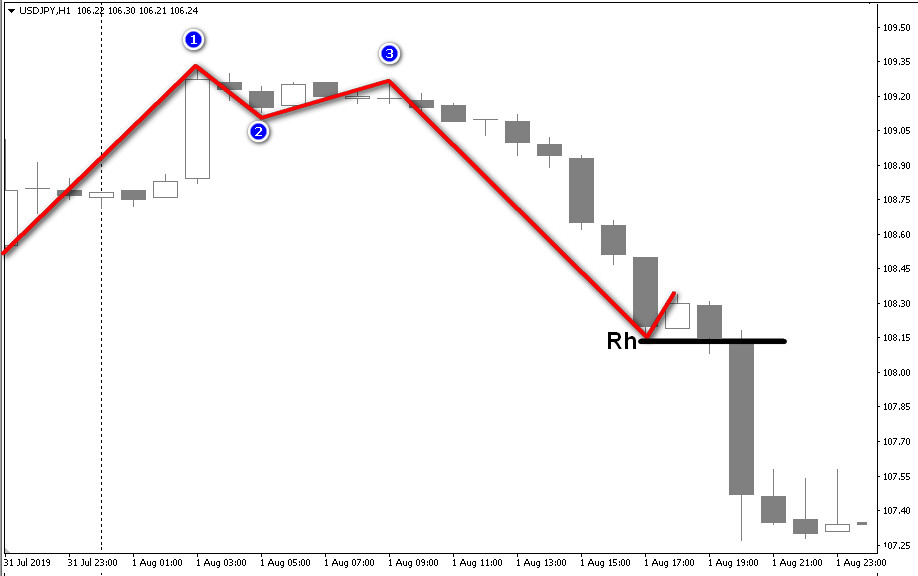
Rh is defined as each new local maximum, formed after the pattern 1-2-3 uptrend, or the first and subsequent local minimums of the pattern after a downtrend.
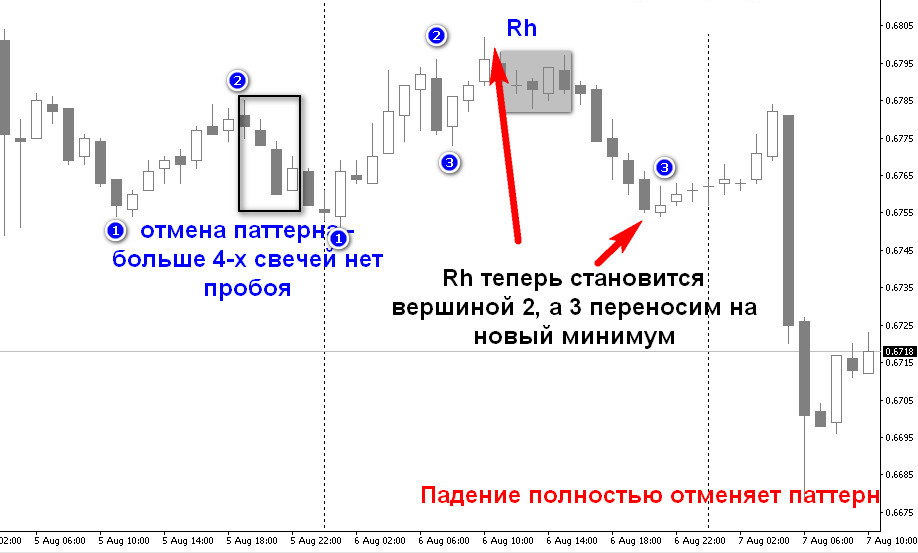
An additional rule – the presence of a trend in the formation of the pattern 1-2-3, installed highs and lows at these points should “break” at the time of formation of the 4 candles.
If after this fourth candle is not moved beyond the point 2 – formation is canceled, i.e. waiting for the new minimum point is 3, 2 breakdown and the formation of another hook.
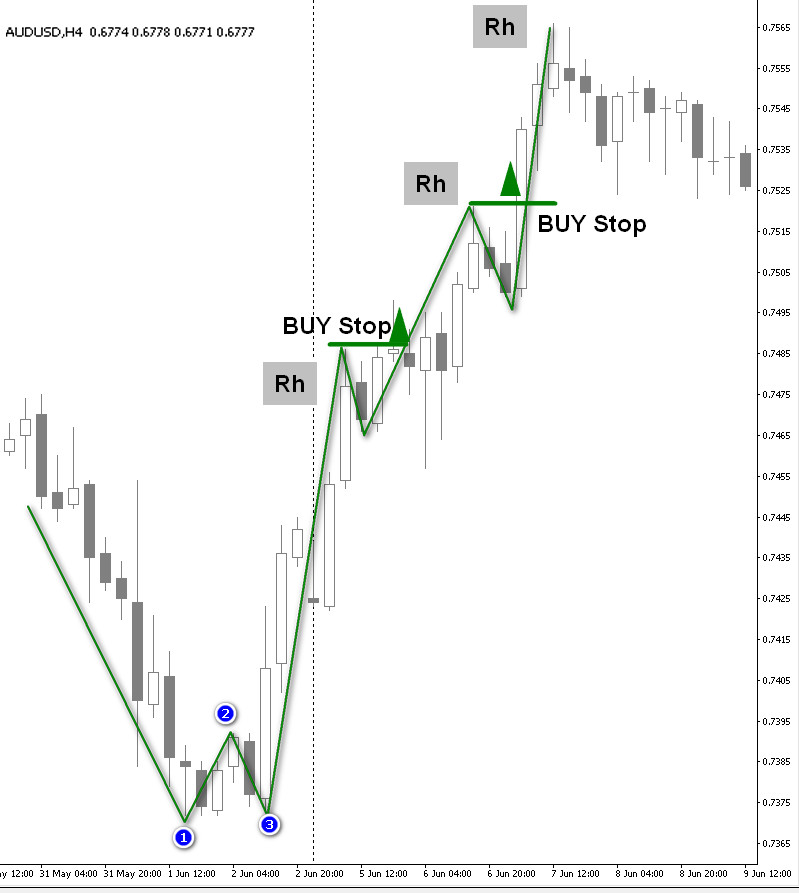
Rules of entry to buy

- Quotes should break through the top 2 of the 1-2-3 formation and set a new maximum;
- Hook Joe Ross formed after the appearance of candles of correction, subject to the prices closing below the opening price and the “presence” of the body, also allows the correction of one or several candles.
That is, doji, “cinders” and the like candle with minimal or absent range of price change between opening and closing are not taken into account.
If conditions are met – the trader sets up a Buy Stop pending order at the level of the local maximum.
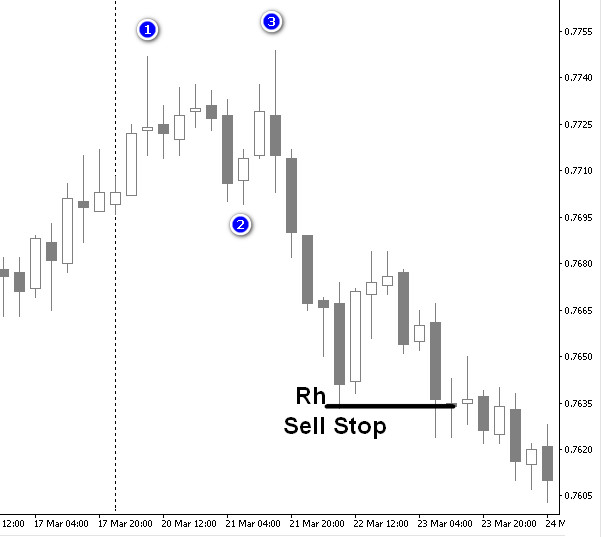
Rules of entry to the sale

- Quotes must break through the bottom formations 1-2-3 at point 2 and set a new maximum (4 candles);
- Hook Joe Ross is formed after the pullback candle or several candles growing, provided the closing price above the opening price and the “presence” of the body.
For entry into a short set pending order Sell Stop on the low level Rh.
Important nuances of the strategy

In the book, describing the trading strategy hook, Joe Ross has shown a variety of ways of following the trend with stop loss and profit growth. In the classic version of the trading system stop is placed at the level of the reverse hook RRh: for long – it will be the first low, confirming the hook; for short, confirming the Rh low.
Take profit there is in classical theory, the trader is guided by the rule a trend until broken RRh.
In the event of a situation of “big foot”, for example, if the correction was on a news candle with a very large range, you can use the ATR indicator. It shows volatility in pips currency that will help in determining the size of the stop.
The take profit can give the Fibonacci indicator, if you draw a trendline from the Rh to the point 1 of the pattern 1-2-3.
Examples of trading Ross hooks

On 4-hour chart NZDUSD formed a reversal pattern 1-2-3, which emerged at the bottom of the downward movement. The condition of the previous trend with three hooks is made, in the picture there are four.
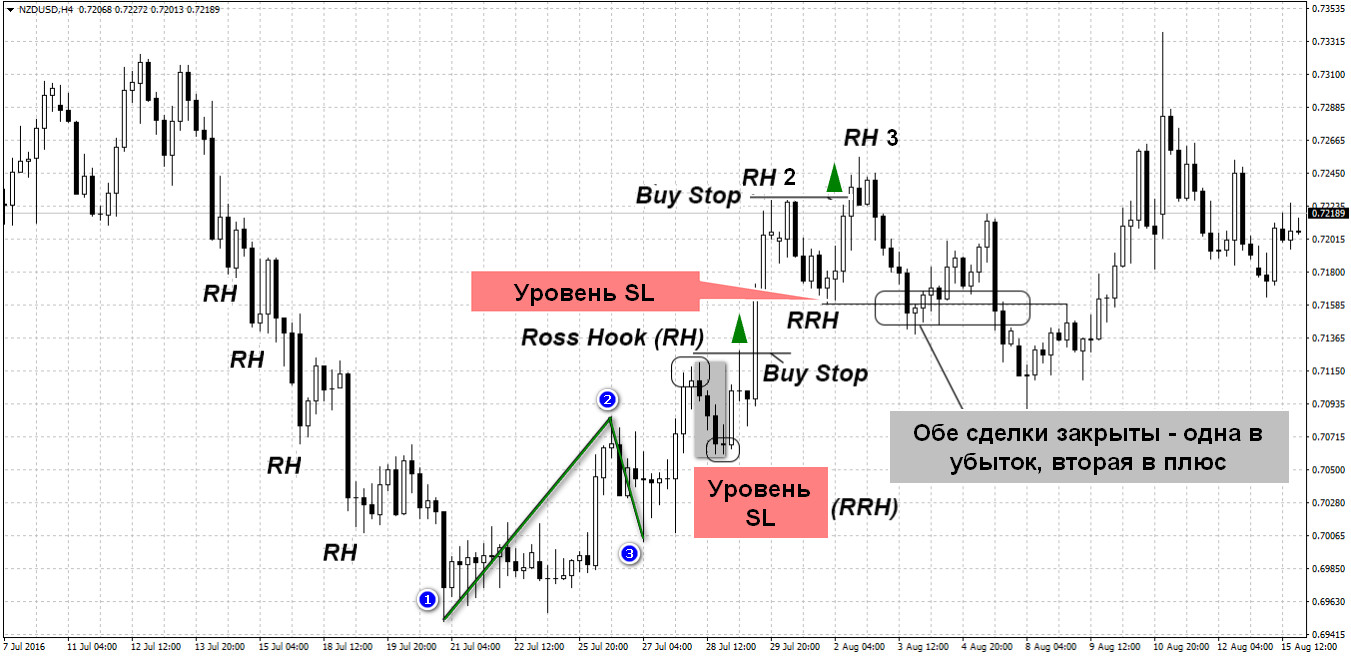
After the first hook begin to count the candles correction, the minimum is set at the first candle to form a reverse hook needed 4 candles – the condition of the trend is made.
The point of the RRh becomes the stop loss level after activation orders Buy Stop. The stop moves higher as soon as the second hook. On the second Rh open another trade setting a stop on both the reverse hook, the first stop is in the positive zone.
As can be seen from the figure, the protracted trend failed to form another hook, the bulls did not have enough strength to break through. Previously opened trades are closed at feet one becomes a take, the second brings a loss.
Filters for Ross hooks

Joe Ross has described quite a number of conditions and nuances of the hooks that can do more to confuse than to help a novice trader, however experienced currency speculators will not discover anything new in the observations of the author.
An example would be filtering by oscillators – indicators that indicate overbought and oversold. Logically it is clear that at such points, the probability of a false breakout of the Rh, and the transaction will fail.
The risk of loss increases significantly when the time of the formation of the hook Joe Ross trader sees a divergence – the divergence of the directions of movement of the indicator and the price of a currency pair. In these moments, the entrance is clearly prohibited.
The coincidence of levels of setting orders Buy/Sell Stop with strong lines of support and resistance or with extrema of the week, month, year is also a reason for the cancellation of the transaction, as well as gap, but the market Forex price gaps – a rare phenomenon.
Conclusion

The strategy of “Hooks Joe Ross” has been forgotten due to the popularity of the pattern 1-2-3. When comparing both tactics clearly apparent signal delay of Rh – in this place the traders fixed profit. By itself, the hook is a great way to confirm and see a 1-2-3 formation, so the strategy is perfect for novice traders.
The trader can learn how to accurately identify the pattern after quite a long training and work on the “hooks” Ross, allowing him to move on earlier inputs. Professional participants of the currency market you can take the Ross hooks on the arms for additional signals to enter the pyramid deals or “positive martingale”.
Forum topic