Which way of trading is the most profitable? Manually or using robots? Technical analysis or fundamental?
Neither one nor the other. The most profitable way to trade – the quantitative, which proves the case of James Simons, the founder of the most successful hedge Fund in history.
Quantitative trading (quantitative trading) – what is it? Today we will try to understand how the strategy of this type, who uses them, and what we should pay attention to when developing their own systems.

Quanta or alternative method does not use any indicators trade

As you know, the main objective of trading is the prediction of the trend or reversal points of the quotes. It is the same for all types of tools and strategies, except in cases of arbitration. Future change in prices, the trader determines with the help of fundamental or technical analysis.
In the case of algorithmic trading fundamental indicators are excluded, robots are tested on a large interval of history, without exception, unexpected political events or economic crises. Loss or profit as a result of such force majeure are taken into account in the total mass of the obtained performance of the strategy.
However, there is a third method of trading in the Forex market that does not use fundamental or technical analysis, trends for him a secondary issue. While the creators of the strategies are far from the markets and topics of trading, the names of the heads of Central Banks for them an empty phrase, but the currency pair are the only characters to download the quotes history.
This method is called quantitative trading replacing the objective of the forecast trend in the search for the optimal Sharpe ratio – set currency pairs and strategies, which together will bring a steady income.

The phrase “constant profit” sounds like finding the Holy Grail for many of us, lost not a single Deposit in the Forex market and read a lot of literature on trading. In fact, the advantage of quantitative trading – this is a proven fact. Investment hedge funds create quantitative algorithmic strategy for over half a century.
Some of the brightest known, and the results of their algorithms, decades worked with profit. In particular, the Fund of George Soros – Soros Fund Management, founded in 1969, the first day only used the mathematical strategy.
The average stable yield Fund – 20% per annum for 50 years, with the financier, in contrast to the funds trading in a constantly growing market shares, for example, Berkshire Hathaway W. Buffett, working in all kinds of tools, even cryptocurrencies (April 2018).
Soros became one of the first traders who have proven the fallacy of fundamental and technical analysis and have earned at major mistakes in monetary policy of Central Banks and of the advantage of the logic of numbers and of mathematical models.
At the end of XX century investments funds and banks have begun actively hiring programmers and mathematicians after the development of the options market and open recognition of Fischer black and Myron Scholes. The Nobel Committee awarded the prize for his discovery of the mechanism of trading that allows you to earn on the market volatility regardless of the direction of the trend.
The black-Scholes model of option pricing has drastically changed the trading strategy and principles of hedging, proving the advantage of the approaches of mathematical analysis, making profitable 80% of the positions of market makers and investment banks.
In the beginning of XXI century began to appear the first major foundations, where founders and the staff were not bound by education and previous occupations with trading or the economy. In their daily work, these companies do not use charts or economic forecasts – only “live” stream of prices of assets that are processed simultaneously by several thousands of algorithms.
Examples of such fully algorithmic foundations where billions of dollars are traded on quantitative strategies without human intervention, are: Two Sigma Investments ($60 billion), DE Shaw & Co ($60 billion), Renaissance Technologies LLC ($110 billion). Companies offer universal algorithms, the investor chooses the markets – stocks, bonds, commodities or Forex.
How to create and operate strategy quantitative trading in the Forex market?

Creating strategies quantitative trading is a complicated mathematical apparatus, which involves the use of special application programs for the automation of model search. If at this stage the company uses standard products such as MATLAB, EViews, etc., after tests on the history of the found strategy checked for compatibility with existing specially zaprogramirovan environment.
Trading system based on the principle “the more strategies, the better”, the same applies to the number of instruments. The purpose of this extension is to provide higher returns at lower risk compared to a certain reference point.
To achieve the best profit, use the following tactics: selects the time interval, which records the values of quotations of prices (for example, closing or tick all of the transaction). The values obtained can be analyzed:
- as a function, then the task of the coder is reduced to the approximation of finding the equations, able to describe with minimum error;
- as the time series, then using mathematical statistics is determined by the most accurate method of analysis with a check for forward tests his abilities to the most accurate prediction of the future values of currencies.
In the first case, given the description graph of a function, the trader determines the period of oscillation and gets pivote possible points of maxima and minima, and the second trends. As additional filters to start the search of entropy to determine the rate of change of quotations: deceleration breached, and the acceleration at the end of a trend, which will deliver “smart stops” in advance locking the deal before the end of the movement or closing position with a minimum loss when trend will end.
Another focus of the econometric analysis is the search for microeconomic selections: a global history of auctions is divided into a minimal set intervals with pre-defined inside parts of the templates.
The objective of this strategy is to find in the current movement of a suitable site in the past, the maximum coinciding with the part of the template. Next, the system predicts future traffic based on the copy of the dynamics of prices from the past microtrack history.
Found many trading systems in the above three directions are formed in one strategy, constantly traded and optimized according to the criteria of money management. Additionally, the trader may include forecast data, economic indicators, inserting the model, showing the relationship of the reaction of the quotes and studied on historical data, but this is rare.
Exploring the many open-source algorithms (which is already outdated), very rare model with built-in analysis of macroeconomics, mainly used only Price Action.
Mandatory conditions for quantitative strategies:
- High liquidity and free convertibility of a currency pair or CFD contract;
- Diversification and recorrelate, having a portfolio of a large number of tools with a low coefficient of interconnectedness changes;
- Many concurrent algorithms.
Examples of algorithms strategies for quantitative trading

When you build an algorithm for predicting currency exchange rates uses the relationship values of currency rates with the seasonality and also the property price movement on the trend. The latter allows us to reduce the graph to the linear form described by the function equation:
Future course of the currency = the Coefficient of the trend + F (value of time – day of week, hour, etc.) + seasonal factor. This allows you to display the chart as a broken curve is divided into linear areas.
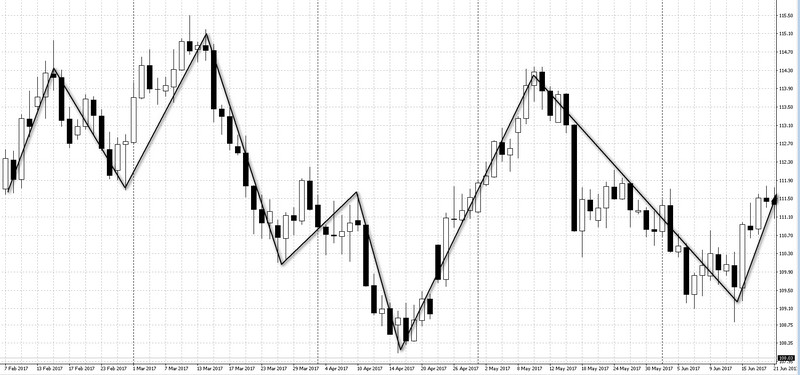
The graph in figure like a broken line of ZigZag indicator, but unlike him quotes predicted by calculated on history factors and known in advance periodically variable constant seasonality.
Once the equation is obtained, the job of a trader is to complete the table with quotations on the last day and hours to obtain the future value (day, hour, etc.). The results of the forecast later automatically compared with the actual value that enables continuous optimization of the equation.
The results are summarized in a continuously updated table that looks like this:
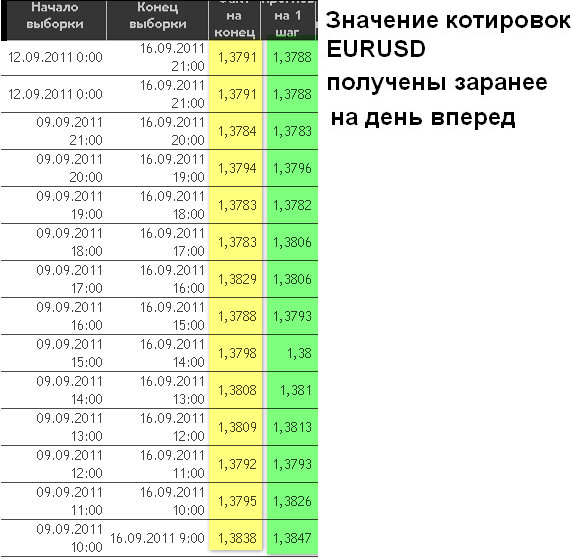
Despite the fact that future prices closing daily candles do not match the TEC in the TEC, they are with high precision allow you to determine the direction of the trend to build a trading strategy inside day.
A nonparametric method of Singular Spectrum Analysis (SSA), as discussed above, a linear approach to time series analysis, which also determines the future direction of trends. If the projected forecast is in the chart, it looks like the following:
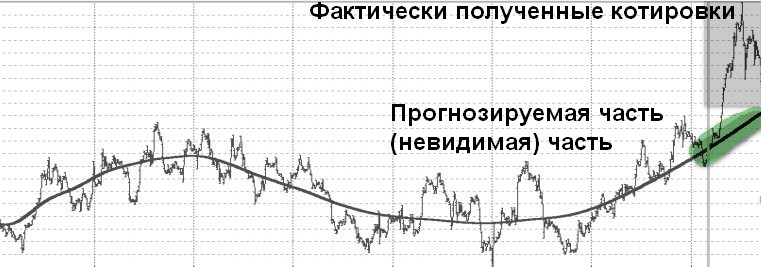
The advantage of this method is the independence of calculations and predictions from the seasonality factor, the volatility, changing periods of the cycles and trends with a large enough sample size of the data window. This interval is determined by the trajectory matrix, which simulatore decomposed into the sum of elementary parts.
The solution of equation allows to represent a time series as trend and noise, allowing the resulting equation to further define medium-term and long-term trends, despite the change of volatility or force majeure motion graphs.
Today, traders are relieved of the need to conduct their own complex calculations and build a vector of matrices of Singular Spectrum Analysis indicators is provided in the form of ready customized template.
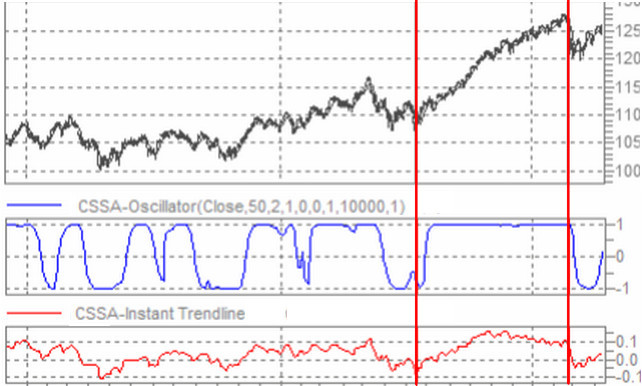
SSA curves are shown in the form of oscillators or trend lines, when combining signals to identify the beginning and end of a trend using periods from 2000 or more candles in history. The only disadvantage – a large number of options in settings and desirable skills to work with algorithms of vector analysis the SSA.
Quantitative trading – the repetition of traditional trading systems?

If we decompose into its constituent pieces of a complex algorithm quantitative trading, then we observe a normal skeleton trading system, which combines three different strategies, commonly used separately from each other.
Attempt of the description of the graph as a periodic function similar to the search for the optimal moving average period than the present day theorists. Surveys have produced many kinds of MA-indicator: various types of using the weighting coefficients to AMA – indicator Kaufman, is able to switch in modes trend and flat.
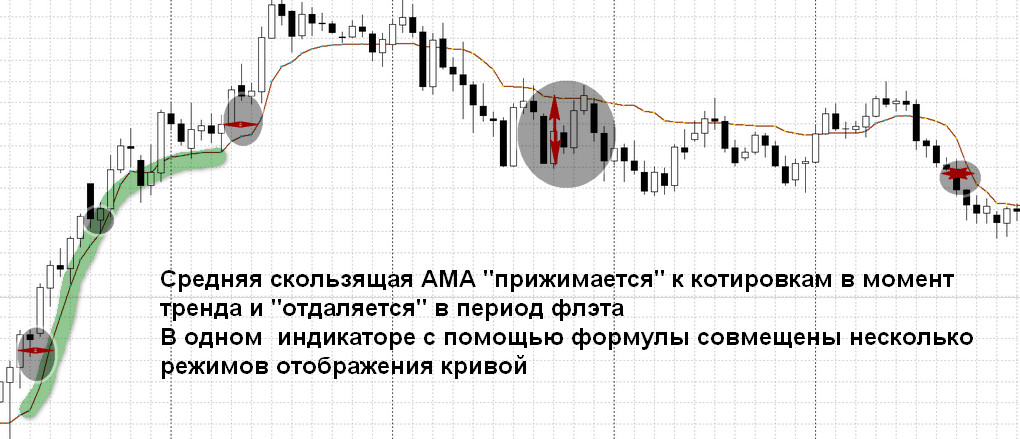
The quest for the ideal was not a success, and now it has been an artificial intelligence company Jurik Research.
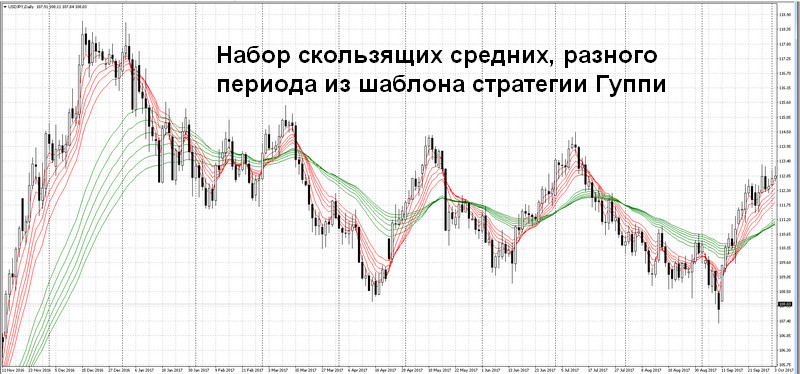
As an example, a quantitative approach to moving averages you can take the strategy of the Guppy, where the Australian trader uses multiple MA with different periods. This is similar to the parallel work of many mathematical algorithms trend strategies.
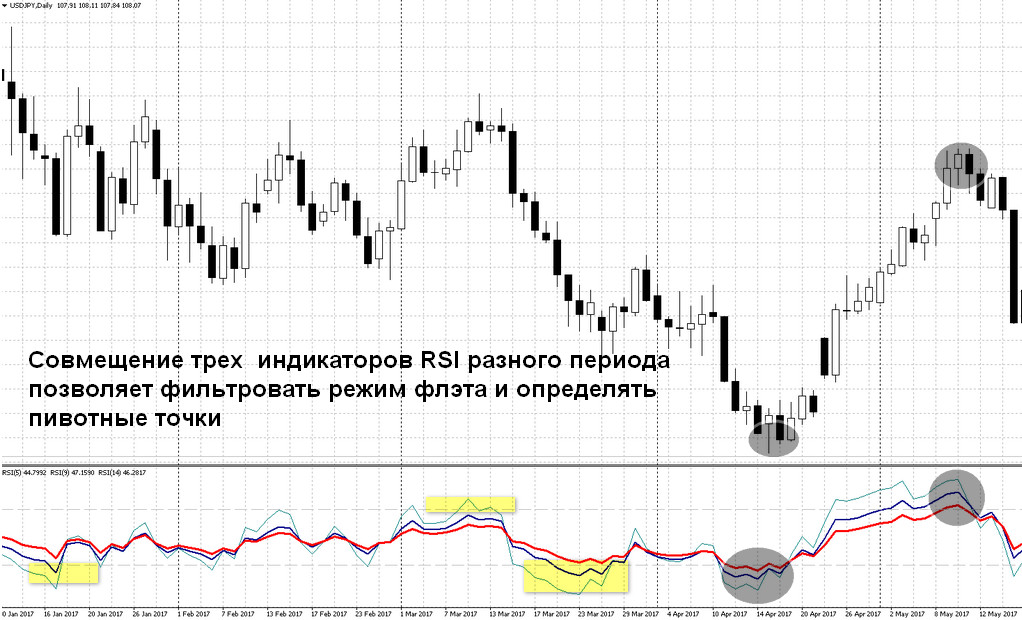
Pivote point you can look for the same principle, using a set of indicators RSI with different periods together in a single timeframe. Combining this strategy and trend trade MA, the trader will receive contritely fixing part of the profit and hedge open positions.
To predict the future trend direction based on trading in the past, use the patterns they described in the books just because we meet regularly over half a century of market trading. Identifying a familiar figure, for example, Gartley or wolf waves, the trader will receive the entry point, stop loss and take profit.
Conclusion

Econometrics and mathematical analysis of economic parameters – the theme of the third course of the University. Students create trading strategies, methods of forecasting exchange rate as term papers and dissertations is the reality of the modern Forex market.
The publication of the article and your feedback will help us to understand how you need to write more in this vein: to compare the existing methods of technical analysis with modern models, to explore the benefits and the practical application, and to attempt to shift the approach of creation of quantitative strategies in the traditional tools with MetaTrader 4/5.