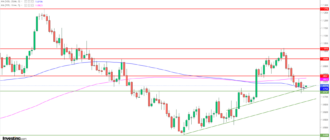
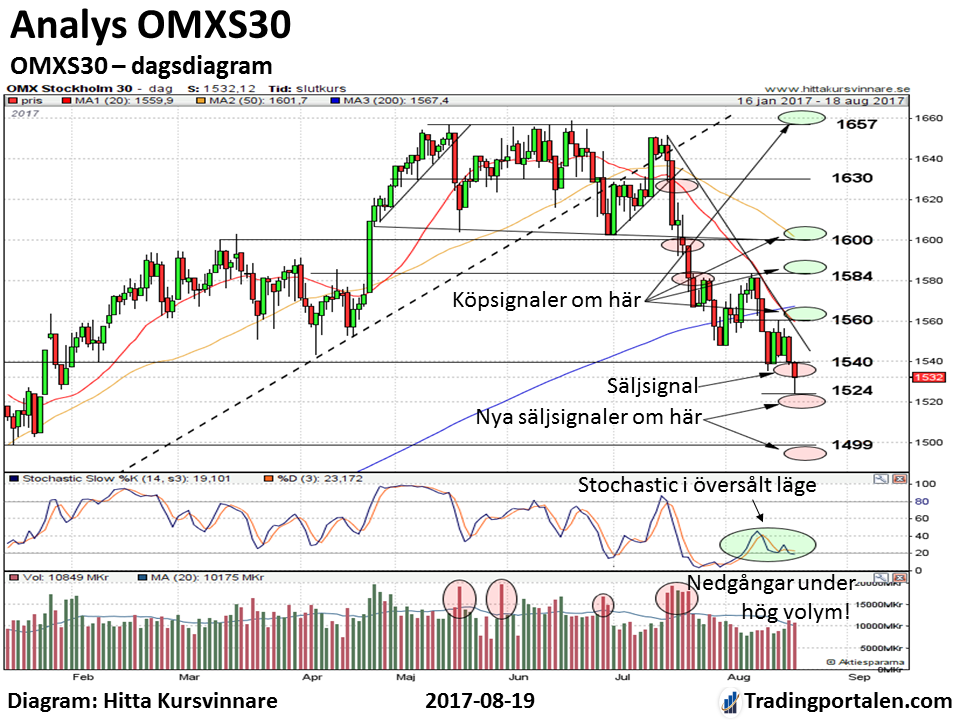
The OMXS30 got last week new sell signals when the index went below the supports at about 1535-1540. New support level to watch is now at about 1524, but a much heavier intensity is at about 1500. The OMXS30 get a buy signal if it establishes itself over the resistors at about 1532, about 1535, c. 1560, about 1583 and c. 1600. Gains that occur during a relatively low trading activity, however, risks to be short-lived. For the long-term trends have begun to go down, and handelsvolymsambanden remains negative. The long-term aktieinvesterarna therefore have gone out in a general köpstrejk. As long as these patterns are looking great risk out to the important support at about 1500, sooner or later, will be challenged.
The stockholm stock exchange turned last week upside down, but closed to the end with a marginal decline. Our Swedish storbolagsindex OMXS30 index went down 0.4 percent and ended the week at 1532,12. Thus is the year indexuppgång only +1.0% and +4.2% with respect to the separate dividends.
In the beginning of the week went OMXS30 up to the most 1560,5 after the ordkriget between the united states and north Korea calmed down, and the risk of armed conflict appears to have diminished.
Get the OMXS30 analysis automatically to your e-mail every week!

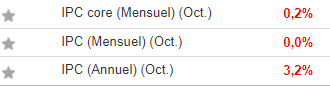
In Sweden, the statistics, which showed that consumer prices, calculated with a fixed interest rate, has risen by 2.4 per cent on an annual basis. It was the first time since 2010 the inflation rate was over 2 per cent.
And with it went both the Swedish interest rate and the exchange rate up. Which meant that the stock market declined. For the appreciation makes to the competitiveness of Swedish listed companies ‘ domestic operations decreases.
The OMXS30 so important bankaktierna strengthened, however, by the rise in interest rates. For the banks make more money if the interest rate can be raised from the present less – and nollräntenivåer. After Wednesday night something soft Fed protocol, however, both interest rates and bank shares down again.
In the united states-the president, Donald Trump’s increasing political problems, he chose in a week, after a number of dropouts, to phase out their advisory groups with the different business leaders. It has further increased the concern that he will not be able to push through their policies of tax cuts and massive infrastructure investment.
In addition to this adds on the now dawning konjunkturpessimismen so, it has struck directly at the OMSX30 company Skanska’s share price. Skanska has been known as a great construction in the united states. Since the top of 229,7 usd for 3 February has Skanskaaktien have gone down by 22.5 per cent.
The long trend for the OMXS30 has now begun to point more and more down. Still, however, the slope of the 200-day medeltalskurvan upward. However, the longer the time the index is below this curve, the faster it will start to turn down.

The short trend, which we define, following the slope of the 20-day medeltalskurvan, however, has been downward since mid-July.
The OMXS30 has also begun to show a clear pattern of declining tops and declining bottoms. Not a good thing. Moreover, trading volume is usually larger during the nedgångsdagarna than in uppgångsdagarna. This is a serious sign of weakness that indicates an underlying weakness in the long-term börstrenden.

And we look at the individual index and aktiediagram so see it as soon as out as to the long-term börsaktörerna has gone out in a general köpstrejk. There are certainly many reasons for this. But the most important factor we judge to be that the central banks flagged up to their monetary policy will start to be tightened up.
The OMXS30 has in the past during the summer, scored a number of strong sell signals. In particular, it took place when aid at about 1600 was broken in a rising trading activity. The past week was the OMXS30 new sell signals when the guides at about 1535-1540 was broken.
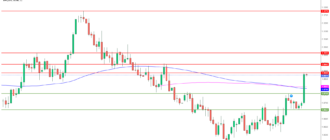
For the OMXS30 should get a little more buy signals need index is now establishing itself over the resistors at about 1560, about 1584, and about 1600 for a relatively high trading activity. Happy with börsomsättningar of at least 22-25 billion in uppgångsdagarna. Is börsomsättningen continued to be low during the peaks there will be long-term how this would be received on any buy signals, unfortunately, low.
Have OMXS30 now started a period of decline, we can expect that it will be fast but short-term indexuppgångar. It is then that the short-term players who have taken positions for the fall feel compelled to buy back their short positions. And then to the other short-term investors to quickly hang on to in order not to miss a rebound.
But then are there not so many long-term investors who buy it becomes a problem. On the one hand is the growth in low trade. And in addition, when the short-term players bought it clear, risk that the index will again turn downward with full force.
So, therefore, becomes the relative trading activity will be extra important to monitor any gains. So far in this nedgångsfas has, however, handelsvolymsambanden been unequivocally negative.
The only thing that is positive is that the OMXS30 index is oversold. The Stochastic indicator is down at low levels. In addition, this indicator has not gone down to the new lower bottoms when the OMXS30 made it. This so-called positive divergence between the indicator and the index makes that any future tables will be extra interesting to watch. Especially if they would then come under an increasing börsaktivitet.
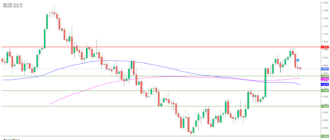
The OMXS30, however, may new sell signals on the support at about 1524 is broken. Then there is a start area at about 1500.
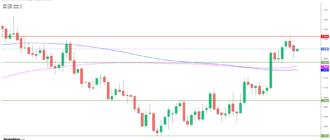
In the short-term timdiagrammet we see that the OMXS30 index may in the short term interesting buy signals on the resistors at approximately 1532 and ca 1535 is broken. Just above it is a resistance level at about 1539-1540, where a so-called gap would be filled. Then there is resistance at a descending trend line, which at the time of writing is at about 1546, and at about 1548 and in about 1556.
But even in this timescale is then the most important resistance levels at about 1560 and about 1583.

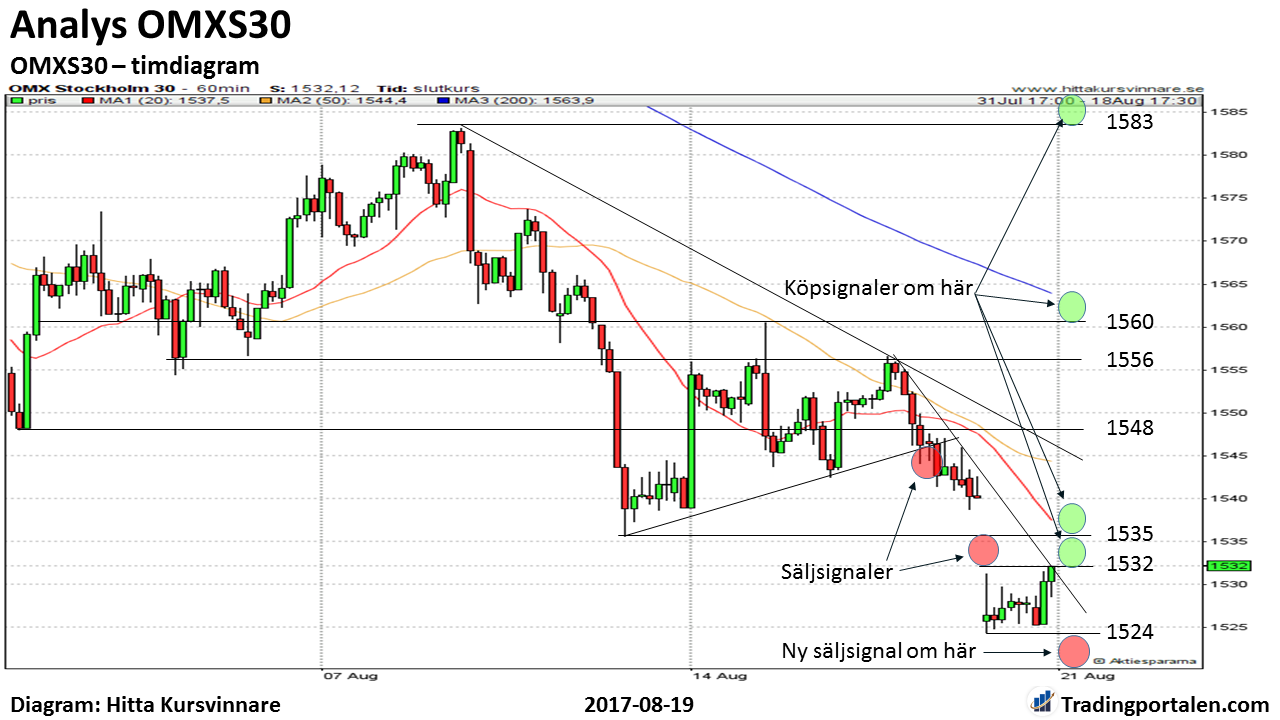
Short-term focused investors can now monitor the resistance levels at approximately 1532 and about 1535. Broken these you can choose to buy for the rise. Make it so, with a smaller positionsstorlekar than usual, monitor stopparna extra carefully and feel free to take home the win as soon as the slightest hesitation in the market.
In particular, this is important if any gains continue to be made during the relatively low trading volume. For huvudtrenden is down and the stock market can withstand when not negative news. And volatility can suddenly increase significantly. Stop loss, preferably just below the nearest support level.
Obtained instead a new sell signal below support at about 1524 can aim on new downs. Aim, first and foremost, down to the important support level at about 1500. Stop loss, preferably just above the nearest resistance level.
For more long-term oriented investors, we want to recommend great caution with the share – and indexinnehav. Börstrenden is downward and handelsvolymsambanden negative. Sales of the remaining holdings at the temporary kursuppgångar. Especially if its happening during the continuation of a relatively low börsaktivitet.
Wait time with the new purchase until strong buy signals received during a rise in trading activity. Or until the stock exchange have fallen more than previously ”thought possible”, the volatility has been extremely high, and a journal that does not normally write about the stock market on its front page writes something of type ”the Stock market has crashed. Shares absolutely should not have”.
For then the have probably all which can think of to sell their shares already sold. And then it can be an interesting location for a long-term investor to start buying the indexplaceringar and quality investments.
Click on the link for more information about ”Focus, strategy and ansvarsbeskrivning”
Upcoming course
“Learn to support Yourself on Your Trading – a complete three-day course!” – see the next course!
More about technical analysis:
- Common concepts in technical analysis
- Moving averages – lagging indicator, which filters out the noise
- MACD – technical indicator, which fits well into the trends
- RSI – a classic momentumindikator that is a ”must” in swingtrading