The OMXS30 find themselves in an uncertain position. Long-term terms, the index is still in an upward trend. But more short term seen is the index for two months in a consolidation phase. Important support levels are at about 1600 and resistance at about 1657. Establishes the OMXS30 during the growing trading activity over the June 1657, received a strong buy signal. But if the index during the high-activity breaks during the 1600s in the obtained instead of sharp sell signals. The stock market tends to be strong during July and bolagsrapporterna looks to be good. But at the same time, inger handelsvolymsambanden, the US dollar and långräntornas development to increasing uncertainty.
The stockholm stock exchange went last week slightly upward during low trading activity. Our Swedish storbolagsindex OMXS30 index moved up a marginal 0.2 per cent and closed at 1617,00. In the years hence, the index has gone up +6.6% and +9.9%, including dividends.
Stock market activity was last week low, as many börsaktörer have taken sommarledigt. In addition there is a cautious stance ahead of the summer reporting period, which begins in mid-July.
However, there is an overwhelming optimism in the reports. They seem to like that many analysts expect that they will be ”better than expected”. Which might well be viewed as something of a contradiction. But you can also ask why you do not buy more shares now when, for example, many of the OMXS30 shares have come down a bit from their year high levels.

Get the OMXS30 analysis automatically to your e-mail every week!
What complicates the situation is, in addition to the uncertainty about how the reports become in fact, both the US-dollar’s decline, and partly to the fact that many central banks indicated that the previously so enormously expansive monetary policy may come to be more subdued.
It is pengafloden from central banks, printing works as stabilized, and also printed most of the international stock markets in recent years. It has also made negative news has not been able to affect the stock markets more than just an occasional basis. To dry up this source of ever-new money that will be placed at risk of the stock markets to become significantly more sensitive to negative news.
Long-term interest rates have also begun to move upwards. Continuing this trend will probably a lot of investors begin to consider obligationsinvesteringar instead of equity investments.
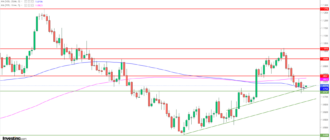
But so far , however, the really long trend for the OMXS30 index continued upward. 200-day medeltalskurvan, which at the time of writing is at 1547, pointing upwards and the OMXS30 index also shows a long term pattern of rising bottoms and tops.
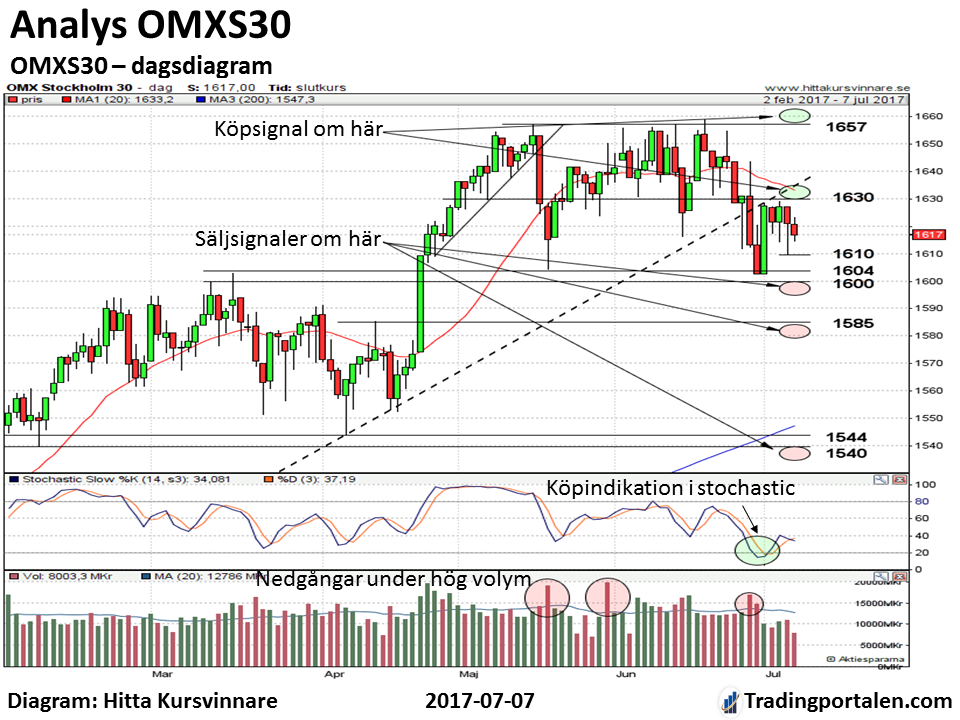


However, handelsvolymmönstret the last few months begun to demonstrate a more uncertain pattern. Trading volume in certain nedgångsdagar have been well as large as in the uppgångsdagarna. This is a warning sign that we are increasing attention on the potential sell signals.
It a little more short-term perspective, however, are the OMXS30 in a slightly demanding phase of consolidation. One can see that the fact that the exchange stands and gathers force in the face of an outbreak. Either up, which would also be in the long trend direction. Or down, which would be something completely new compared with the last year’s börsbeteende.
Establishes the OMXS30 during an increasing trading activity across the resistor at about 1657 obtained strong buy signals. In this case, we aim on the gains at least up to the ancient peaks at about 1720.
Would instead OMXS30 establish itself in the support area at about 1600 in the large volume of trading obtained strong sell signals. Intensities are then already at about 1585. But there is a significant risk that in this case even these are broken. And that index, then at least go down and test the support area at about 1540-1550.
Buy and sell signals obtained during a relatively low volume of trading, type clearly over 20 billion in stock market turnover, however, clearly lower signal value. In this case, often becomes indexrörelsen much more modest. In addition, increasing then the risk of false signals.
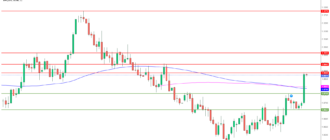
The Stochastic indicator was , however, a köpindikation last week. Stochastic went up from a low and oversold mode, in conjunction with the largest dagsuppgången on the OMXS30 in two months. The index went last Monday, up by 1.6 per cent. However, the rise phase, with a very modest volume of trading at only 12.9 billion. Thus the takes how this would be received of the movement.

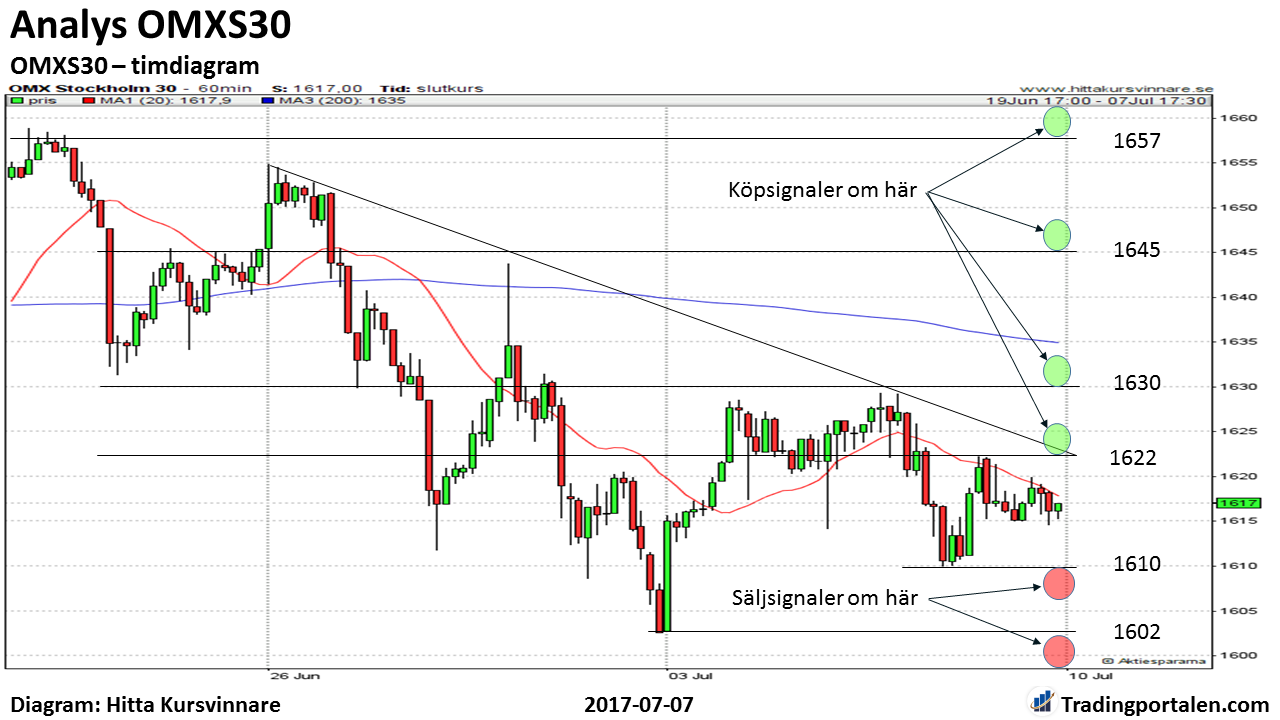
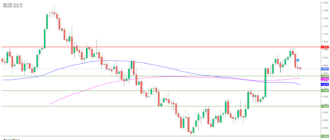
In konsolideringsområdet between about 1600 and about 1657, that the kortsiktige the operator can see that a tradingintervall, can OMXS30 also get more short-term interesting buy and sell signals.
If the OMXS30 index breaks above the resistance at about 1622, about 1630, and about 1645 obtained short-term buy signals. Acting with short-term time horizon can buy then for the rise after the buy signal. Aim then on gains to first and foremost closest to the horizontal resistance level. Stop-loss perhaps just during the day poof’s lowest level.
Would OMXS30 instead go under the supports at about 1610, about 1602, and about 1600 obtained a sell signal. In that case you can act to decline. Preferably with a stop just above the closest horizontal resistance level.
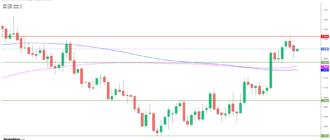
Is one more long-term oriented, so can be as long as the support level at about 1600 on the OMXS30 and agree to act as the long trend is upward. If the index is in a relatively high trading activity to establish itself above the resistance at about 1657, this is confirmed and you can then aim for at least 1720.
Would, however, support at about 1600 mined in increasing volume of trading obtained a strong sell signal. In such cases, it is recommended to consider a stop loss also on more long-term holdings.
But if you want to take the lower risk, we recommend that you have already prior to this sell off parts of their holdings at any gains. In particular, if these gains occur in a relatively low trading activity. For the level of risk has been raised on the stock market.
Handelsvolymsambanden, US dollar and number of shares and the international stock index shows weakness. And will bolagsvinsterna increase enough to compensate for the long-term interest rates are raised? Year ending on the -7 also has also a nasty habit to invite the hearty downs in their second half of the year.
Click on the link for more information about ”Focus, strategy and ansvarsbeskrivning”
Upcoming course
“Learn to support Yourself on Your Trading – a complete three-day course!” – see the next course!
More about technical analysis:
- Common concepts in technical analysis
- Moving averages – lagging indicator, which filters out the noise
- MACD – technical indicator, which fits well into the trends
- RSI – a classic momentumindikator that is a ”must” in swingtrading