October is often a interesting month, but this year October is of particular interest for us, who applies methods spring out of W. D Ganns work. This year it is on the u.s. exchanges, namely 10 years since the peak in October 2007, and 30 years since the crash of 1987. This at the same time that we are in a year that ends up on the number 7, and those kind of years, history has taught us can get off to a shaky autumn. Given the respect one should have for 30 the cycle of the seasons as it is to find the setups that have a clear relationship between risk and reward while at the same time should have a clear framework. Such a situation, we are currently in Facebook, we get press like the (buy) button, or not?
Get Minianalys Shares Global automatically to your e-mail every week!
Facebook is a brand that hardly needs a closer introduction. It will apparently be especially used by persons in the 35 – 45 years of age. Like most american teknologiaktier with dignity has Facebook’s development in the past few years has been outstanding and the question now is whether it can go to in the near future, capitalize on the rising trend.
Facebook set its latest All-time high at 175 dollars on July 27 this year, and has since been moving sideways. A movement which generally is particularly strange given the earlier strong development. At the same time as the lower peak, which came in the 12 september to be respected. A lower peak 45 days after a previous peak is considered as a warning signal because it is 1.5 times the rhythm of 30. The type of relationships in time should mean that you are on your toes.

With the above said, we came to the bottom, which so far represents the lowest bottom seen from the top, in the 25 september. Two months is 60 days, which is 2 times a 30 days. Thus, an interesting reaction.
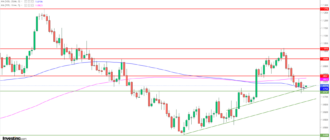
Facebook has a support/resistance level where we now find ourselves, that is to say, around 170 dollars. Additional support should be located in the area around 163 and 161 respectively dollars where the bottom from the 25 september to appear. Resistance, we have the falling trendline that connects the peaks from 27 July to 12 september.
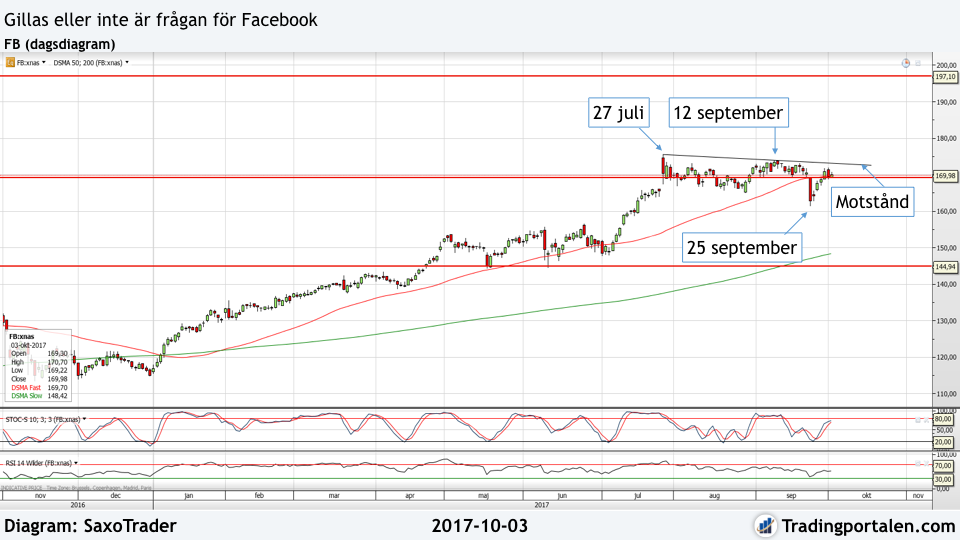

Facebook (daily chart)
Facebook is in a sensitive location and it is in the balance. But if the stock can break up over the above-mentioned peaks, we have a buy signal in place. The trigger we set as a daily closure over 173 dollars. Our target level for the movement, we turn to the Gann level of 197 dollars and the stops can be placed as a daily close below 169 dollars.
Take a look at the daily oscillators, they look for the moment out to possibly be on your way to roll over face down, at the same time, they find themselves in no man’s land, and indicates not more than that share in the worst cases consolidate. Regardless, they learn to have cheered if our setup is triggered. For no signal, we don’t act. Facebook reports at the end of October and they should not be, if it is not located in a good plus to keep the position over a report.

Facebook – an overview
Entrance buy
$173.00
Ticker
FB
Målkurs
$197.00
Market
The Nasdaq
Emergency exit
$169.00
P/E (est 2017)
31.7
Latest
$169.98
Direct avk. (est 2017)
0.0 %