The OMXS30 got last week strong sell signals when a number of support levels, including the important support at about 1600, was broken in a relatively high trading activity. Long-term strong support levels are now at about 1540-1550 and about 1500. The really long-term trend is still upward, but it may be challenged in the next, seasonally, so weak, months of the year. Long-term strong support levels are now at about 1540-1550 and about 1500. In the short term, however, is the OMXS30 oversold. So a bounce up would not be so surprising. Temporary upward recoils that occur during low-trading session, however, we primarily interesting säljtillfällen for the långsiktige investor. At present, it is only if the OMXS30 during a relatively high börsaktivitet establishes itself over the resistors at about 1600 and about 1657 as a strong buy signal is obtained.
The stockholm stock exchange fell last week, quite properly, in relatively high trading activity. Our Swedish storbolagsindex OMXS30 was down 4.0 per cent and ended at 1581,37. In the years hence, the rise has been reduced to +4.2% and +7.5% with respect to dividends.
During the last week continued to present reports to pour in. Among the OMXS30 companies became the positive rapportreaktioner for Alfa Laval, Boliden, Electrolux, Fingerprint, Swedish Match Tele2.
Unfortunately, dominated the negative rapportreaktionerna. ABB, Assa Abloy, Atlas Copco, Ericsson, Essity, Getinge, Kinnevik, Nordea, Sandvik, SCA, Skanska, SKF, SSAB, Handelsbanken, Telia and Volvo, fell after their respective reports. SEB continued down in spite of a strong report for the week.

This that the stock market reacts negatively to the reports, and especially when they have been pretty good compared with förhandsprognoserna, is clearly worrying. This does not bode well for the coming months stock market performance. Because if not the stock market go up on good news, how would it go if it comes bad news?
Get the OMXS30 analysis automatically to your e-mail every week!
The expectations of companies ‘ reports, however, seem to have been to ”exceed expectations”. Which of course is a tad contradictory, which we also raised in our OMXS30 index-analysis 10 July.
Then we wrote also that ”What complicates the situation is, in addition to the uncertainty about how the reports become in fact, both the US-dollar’s decline, and partly to the fact that many central banks indicated that the previously so enormously expansive monetary policy may become more subdued”.
The US dollar has also continued down the last few weeks. And in the past three months has the US dollar gone down with the entire 9.5 per cent vis-à-vis the Swedish crown. Even if companies like HM are considered to benefit from a declining value of the US dollar as this tends to generally not be good listed companies ‘ earnings capacity of a project.
So what, then, has the strongest impact on the börsläget? Rising profits? Or concern for the future ränteuppgångar and a continued weak U.S. dollar? And for that the stream of new venture capital from the central banks ‘ printing works is going to dry up and affect the börsläget negative? Yes, right now it seems in any case not vinstökningarna have the upper hand.

It seems as soon as be a particular concern for börsuppgångarna already discounted in vinstökningarna. For example, OMXS30 index, including dividends, in the last 12 months gone up by 18.8 per cent.
Despite last week’s decline, it is, however, the really long trend for the OMXS30 according to our definition, the slope of the 200-day medeltalskurvan, continued upward. The OMXS30 is also maintained in the long-term pattern, with both rising bottoms and rising tops.
But the long trend is now starting to be challenged by the clearly troublesome indexnedgångar which, moreover, occurs during a rising trading activity.
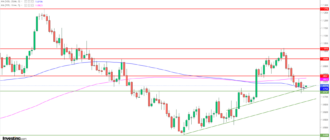
The OMXS30 last week received a number of sell signals. The strongest säljsignalen was that the OMXS30 index closed below the important support at about 1600. In the weekly chart below, you can also say, moreover, that it was associated with the highest veckobörsomsättningen the last two years.
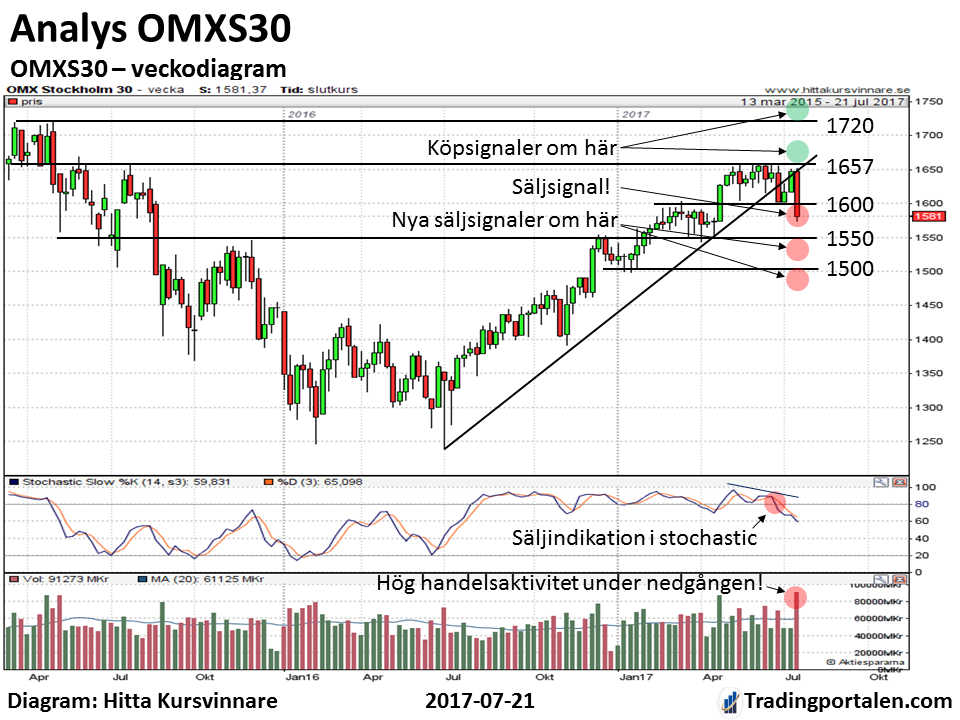

The OMXS30 has now long-term key support levels at about 1540-1550 and about 1500. The negative handelsvolymsambandet indicates that the risk is great that these support levels will be tested in the next few months.
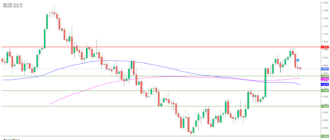
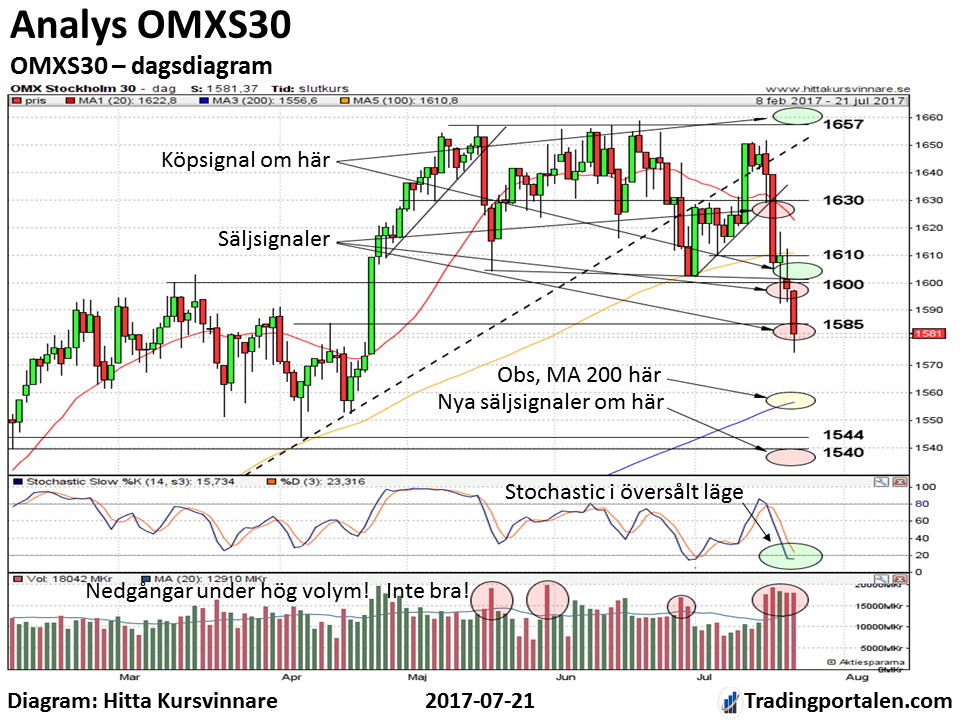
In the day chart below we see that the OMXS30 index also got a sell signal when the guides at about 1640, about 1630, about 1610, about 1600 and about 1585 was broken. And this, therefore under relatively high börsomsättningar. Unfortunately, this reinforces the long-term how this would be received by these sell signals.

What is required now to reverse the börsscenariot to a more positive mode is that the OMXS30 may börsuppgångar and buy signals at least during the same trading activity during the downturn.
So would the OMXS30 establish themselves across the resistors at about 1600 and about 1657 in börsomsättningar at least 23-35 billion per day during the uppgångsdagarna obtained strong buy signals which takes out last week’s sell signals. Is gains, however, clearly a lower trading activity, they are urgently seeing a temporary nature. And that säljtillfällen for the långsiktige investor.
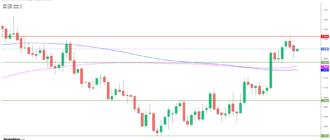
On the downside, there are short-term support levels at last week’s lowest level in about 1575, at about 1557, where the 200-day medeltalskurvan on the OMXS30 index is and at about 1540-1550 area.
Even if the weekly stochastic of the weekly chart signals the long-term decline so it is the shorter term stochastic in the day chart in an oversold position. Therefore, the OMXS30 is now quite easy to get a little bit of give sufficient short-term uppåtrekyl.
Is such a rise with a relatively low trading activity means it is not so much in the long-term perspective. But for more short-term oriented actors can, of course, be interesting.

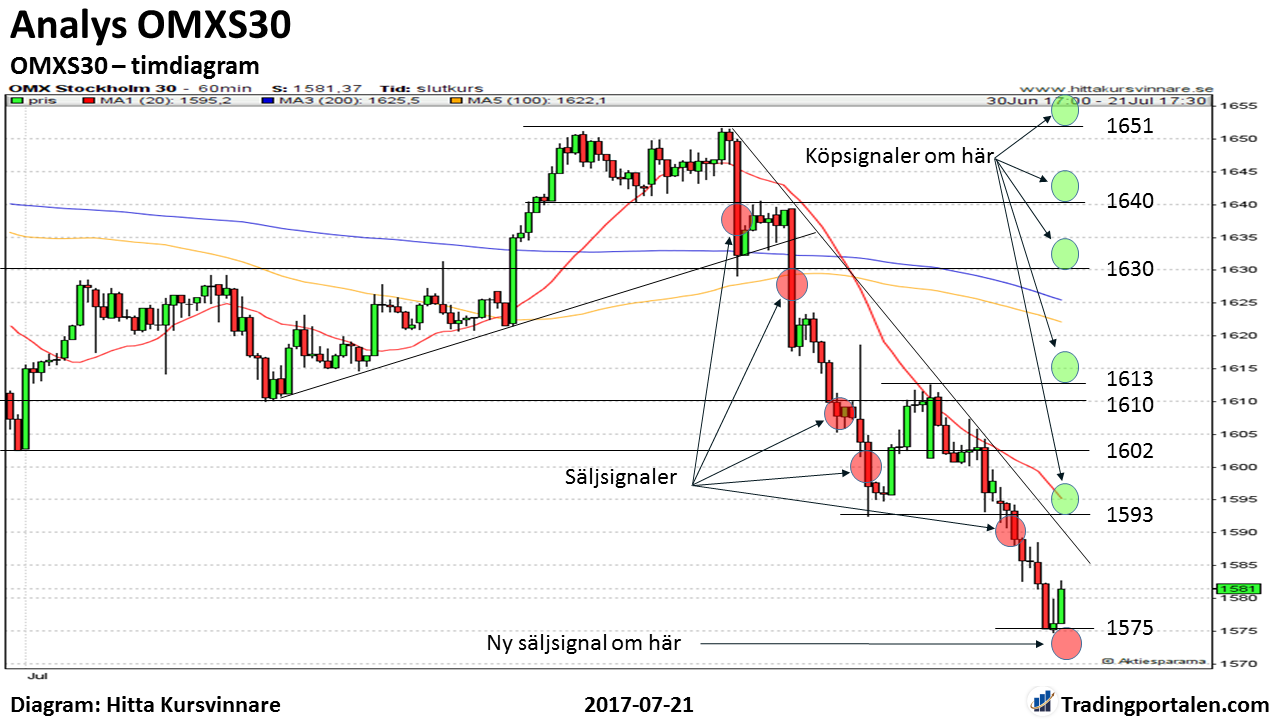
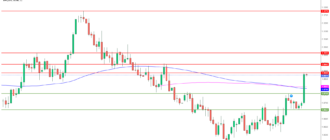
In timdiagrammet see we OMXS30 get short-term buy signal if it goes over the resistors at about 1593, about 1600-1602, about 1610-1613, about 1630 about 1640.
Acting in the short term on these possible buy signals, we recommend that you do it with something to lower the size of their trading positions. Thus, trade with less money than usual to take less risk. For the risk is now great that the OMXS30 index will swing considerably more than in the past and that the long trend is turning down. Stop loss, preferably just below the next horizontal support level.
Would instead OMXS30 continue down below the support at about 1575 obtained new sell signals. Then you can aim on the new downs to, first and foremost, about 1557, and then down to about 1540-1550. Stop loss, preferably just above the nearest resistance level
Acting mainly with long-term strategies, we feel it is important to pay attention to the OMXS30 received long-term key sell signals for a relatively high trading activity. In addition, is säsongsmönstret negative for the stock market over the next few months.
As the onion on the salmon is also the historical pattern of major downturns on the stock market sometime during the second half of the year for ”all” years ending on -7. Why this is so is perhaps not so easy to understand. And any time a well this pattern is also broken. But it was so in all cases, the years 1977, 1987, 1997 and 2007. So some risk, unfortunately, that even in the year 2017 shall be added to this series.
Is carefully laid , we recommend a stop loss for the whole or parts of the even more long-term share – and indexpositioner. Are you willing to take more risk, you can try to wait for the temporary indexuppgångar before it sells.
This recommendation is valid until the very clear buy signals are obtained in the OMXS30 index. In the present situation, it would for example be if the OMXS30 establish itself above the resistance at about 1600 or above it at about 1657, under a relatively high trading activity. But before something similar happens see it best to be cautious on the stock exchange.
Click on the link for more information about ”Focus, strategy and ansvarsbeskrivning”
Upcoming course
“Learn to support Yourself on Your Trading – a complete three-day course!” – see the next course!
More about technical analysis:
- Common concepts in technical analysis
- Moving averages – lagging indicator, which filters out the noise
- MACD – technical indicator, which fits well into the trends
- RSI – a classic momentumindikator that is a ”must” in swingtrading