The OMXS30 get strong buy signals if, during a rising trading activity can establish itself above the resistance at about 1657. In this case, we aim for a rise to at least about 1700-1720. This week tends to be a seasonally weak week. So the risk is large that the index in the next few days is left in the konsolideringsområdet between the important support level at about 1600 and resistance at about 1657. Or maybe even break down? We’ll see. The OMXS30 may in all cases clear sell signals on the support at about 1600 is broken. USD, long-term interest rates and handelsvolymsambanden warns of weakness. However, they are more long-term trends are strongly bullish, which suggest that the OMXS30 index will sooner or later have good opportunities to break out upwards. In addition, säsongsmönstret stronger already next week.
The stockholm stock exchange, went last week down in a somewhat increased volatility compared with the week before. Storbolagsindexet OMXS30 fell by 1.1 per cent and closed the week at 1635,94. The index thus has this year gone up with +7.8 per cent and included the secluded dividends with +11.2%.
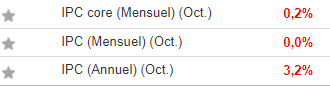
During the week raised as expected the us central bank, the Federal Reserve of its benchmark interest rate by 25 basis points and flagged up for an increase later in the year. Fed chief Janet Yellen also said that a reduction of centalbankens balance sheet can be current within a not-too-distant future. Perhaps, this can with time come to halt the current decline in the dollar that might otherwise put a damper on börshumöret.
Another sinker for the stock market situation has been indextungviktaren H&M that despite large share purchases from the Persson family just continues to go down.

Get the OMXS30 analysis automatically to your e-mail every week!
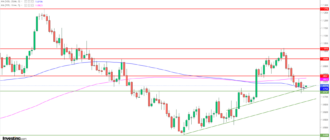
On the long-term, however, is the trend for the OMXS30 index is clearly upward. It can be seen in the long-term pattern, with gradually rising higher and higher, both tops and bottoms. And on the index’s 200-day medeltalskurva stubbornly pointing up.

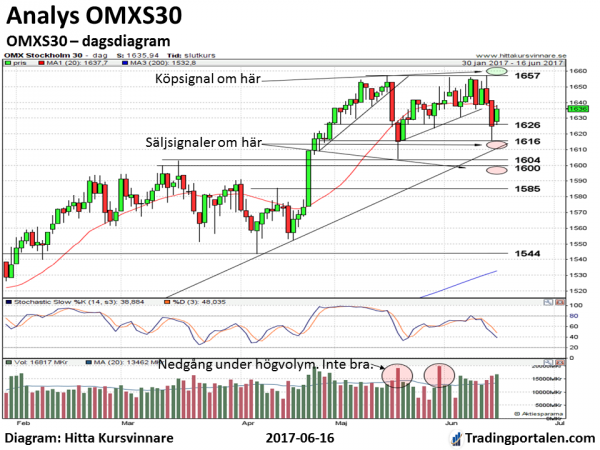
It a little more short-term perspective is, however, the OMXS30 left in the konsolideringsfasen between the important support area at about 1600 and resistance at about 1657. The index did in the middle of last week an attempt to break above resistance. The maximum was OMXS30 then up on the 1657,2. But had unfortunately not have the strength to stay on those levels.
Would OMXS30 at a later time succeed in establishing itself over the 1657, in particular if this can be done with a relatively high trading activity with börsomsättningar well over 20 billion per day during the uppgångsdagarna, obtained strong buy signals. In this case, we aim on the gains at least up to the area at about 1700-1720.
This week , however, we are not so big expectations for this to happen. For seasonally usually the stock market now have a slightly weaker period with a lågpunkt usually around actual midsummer. Ago usually however, the stock market situation quickly able to become better. The stock market usually go up and reach a peak in July or August. We will see if the stock market in the year will follow this usual seasonal pattern. For even if this happens quite often, so it does not happen every year.

However, if the OMXS30 index closes below last week’s lowest level at about 1616 obtained a sell signal. In this case, we aim also on a test of the important support level at about 1600-1604. Should the index also be established under this intensity, particularly if this were to happen in an increasing trading activity, obtained a much stronger sell signal. Intensities are then at about 1585, but probably then becomes the support level at around 1540-1544 the next important waypoint.
The Stochastic indicator is in a neutral location and tell a story not about which direction the eruption will occur.
However, what speaks for an outbreak up is the long trend direction. Should they have to take a chance on something, so it’s usually best to invest in the long trend direction.
What speaks for an outbreak down is some doubt in the handelsvolymsambanden and the US dollar and långräntans weakness in the latest month.
But the best is simply to wait and see the direction in which the outbreak takes place. Is it over in 1657 or during the 1600?
Then, it is also important to pay attention to if these bursts occur during a growing trading activity or not. Trade is relatively high at the outbreak becomes also how this would be received high. But they happen over a relatively low volume of trading will be kurspotentialen significantly more uncertain than otherwise. And the risk of false signals increases also significantly.

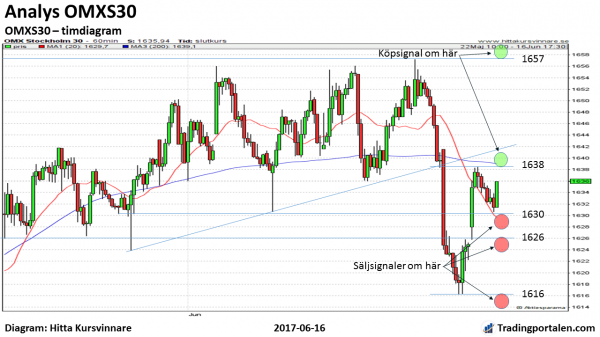
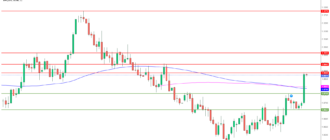
For the short-term – focused investor, you can in timdiagrammet see above that there are support levels at about 1630, about 1626, and about 1616 and a resistance level at about 1638 to act on.
Then you can for example buy only if the resistance at about 1638 to be crossed. Aim (in this case, a rise to in the first place the resistance at about 1657. A stop loss is suggested on the support at about 1630 broken. For go OMXS30 index below support at about 1630, you can then aim for a decline to the support at about 1626, and thereafter down to it at about 1616, and then to the intensities around ca 1600-1604.
For more long-term oriented investment strategies, you can like to pay attention to, even if the long-term trends pointing up, the level of risk increased significantly in the last month. Handelsvolymsamband, US dollar and bond rates have begun to give svaghetssignaler.
You are cautious, you sell , therefore, of parts of their holdings at the gains. Would OMXS30 start to go down during the relatively high trading activity, especially if the aid is at about 1600 is broken, can the försiktige investor is to consider to stop out even more long-term holdings.
However, if the OMXS30 index closes above the resistance at about 1657 under a clearly increasing trading activity takes this signal out of the previous warning signs. We aim (in this case, a rise to in the first place about 1700-1720 on the OMXS30 index.