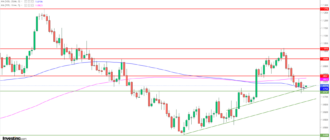
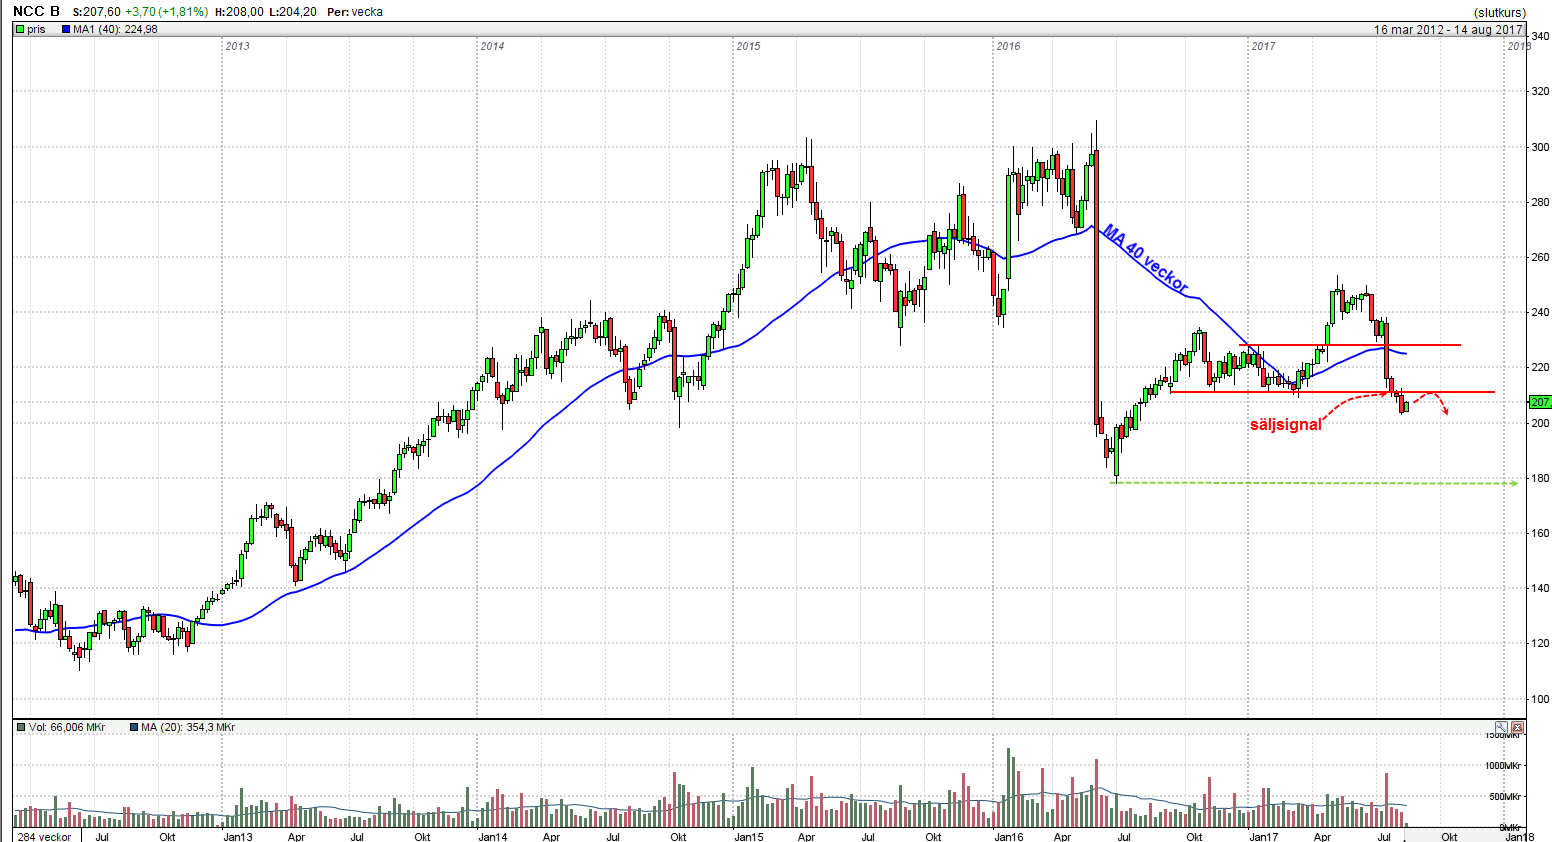
NCC, B has shown weakness by force of the aid around the 228kr, followed by further decline through the next support is at 211kr. The stock is technically weak and a great short selling candidate in a backlash up against the 210-211kr.
NCC B share belongs to one of the weaker shares on the stockholm stock exchange after a breakthrough down from a dubbeltopp-formation that formed between 2015-2016. In the past year, the shares have shown a backlash of more than 50% of the previous fall which has taken the share price past the resistance at 228kr up to a top listing on 253kr in 2017.
The shares have in recent weeks showed significant weakness by pass dual support on the downside which sparked the two sell signals. The turnover has increased significantly in the breakthrough and the share appears to be an excellent blankningskandidat in accordance with a weakening in the stock market as a whole.
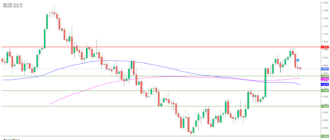
The nearest avstämningsnivå on the downside consists of the July bottom from 2016 around 178kr which is the short-term drop. We see a blankningsläge manifest themselves at a smaller backlash in the last few weeks drops in price up against the 210-211kr transformed into a powerful resistance.

Would the share the against all odds show strength through to significant close above the 211kr is the next level at the 228kr and it is only at a crossing of the latter, as the technical picture turns from negative to neutral. Forced 178kr on the downside, it opens up for further decline against the 141 followed by 115kr.
The stock is traded on the stockholm stock exchange, under the symbol NCC B.
Entrance sell
210-211kr
Ticker
NCC B
Målkurs
181kr
Market
The OMXS Large Cap
Emergency exit
217kr
P/E
14.5
Latest
207.60 £
Direct avk.
3.9%


Click on the link for more information about ”Focus, strategy and ansvarsbeskrivning”
Upcoming course
“Learn to support Yourself on Your Trading – a complete three-day course!” – see the next course!
More about technical analysis:
- Common concepts in technical analysis
- Moving averages – lagging indicator, which filters out the noise
- MACD – technical indicator, which fits well into the trends
- RSI – a classic momentumindikator that is a ”must” in swingtrading